Through epoch 623 · 2026/04/09Nicolas Henin · 2026/06/18
CIP-0050 · Pledge Leverage-Based Staking Rewards · 2022, updated 2025 · Liesenfelt et al. · adds one parameter L · hard fork required · Problem validated · root-level solution researched · recommendation: repair the pledge signal at its source first, then assess whether the σ′ cap is still needed as a secondary step
CIP-0050 attacks the diagnostic's central pledge pathology — 95.6 % of the pledge-bonus budget returns to reserve unclaimed (POL.O1.F3), 78 % of staked ADA sits in pools with pledge ratio below 1 % (POL.O2.F1), and pledged ADA earns 0.68 %/yr against 2.3 %/yr passive (POL.O2.F2). The proposal converts pledge from a 22 % yield nudge into a hard cap on reward-eligible stake: a pool collects rewards on at most $L \cdot p$, with $L = 100$ the recommended endpoint.
CIP-0050 is the sharpest pledge-as-signal lever in the candidate bundle — and it lands cleanest once the root-level repair has restored the signal it caps. The cap delivers two structural properties by algebra (zero pledge → zero reward; pool-splitting revenue-neutral). The depth the diagnostic adds: the root cause of the broken pledge signal is the bonus function A(ν, π) in the SL-D1 reward formula, which CIP-0050 leaves untouched, so at $L = 100$ the standalone cap clips ~84 % of productive stake — including pools that produce blocks reliably and serve delegators well. Repair A first and the population can pledge up before the cap binds; the cap then reinforces a working signal rather than clipping a broken one.
Three findings frame the assessment:
The cap is mechanically sharp — both design properties hold as theorems, not predictions.
The change is too radical: ~84 % of productive stake clipped at L = 100, including pools that produce blocks reliably and serve delegators well — and the root cause of the broken pledge signal (A(ν, π)) is left untouched.
In today's regime, most of the pool pot returns to reserve unused: distribution efficiency falls from 44 % to ~8 %, and network-wide delegator yield collapses from ~2.27 % to ~0.44 % — an 80 % drop. The closing-incentive-gap pathology the diagnostic flags (POL.O1) gets dramatically worse, not better.
The instrument names the right target and lands cleanly on it — but lands on a population the V2 spec is supposed to protect, not discipline.
Table of Contents
1. What CIP-0050 proposes
CIP-0050 turns pledge into a hard cap on pool earnings. The new rule: a pool collects rewards on at most $L$ times its operator's own pledge, on top of the existing saturation cap.
Three consequences fall out immediately:
A pool with zero pledge earns zero reward.
Splitting one pool into many leaves the total reward cap unchanged.
Pledge becomes a binding constraint on what the protocol pays out.
The instrument adds a single dimensionless parameter $L$ (the proposal targets $L = 100$). It needs a hard fork to install the new ledger variable; no pool re-registration. It is the sharpest pledge-as-signal proposal in the candidate bundle.
2. The problem it tries to fix
Today, pledge barely affects what an operator earns. The mainnet evidence is clear:
78 % of staked ADA sits in pools with pledge ratio under 1 %.
42 of the 48 largest multi-pool operators forfeit the pledge bonus entirely.
Pledged ADA yields ~0.68 %/yr; the same ADA placed as passive delegation yields ~2.3 %/yr.
Operators have rationally chosen to ignore the pledge bonus — it costs them more than it pays. The reward formula prices pledge as a soft 22 % nudge, and the operator population treats it as cosmetic.
CIP-0050 converts that nudge into a constraint: no pledge, no reward.
Sybil resistance — what is actually being defended.
A Sybil attack is when one person pretends to be many. In Cardano staking, that means a single operator running many separate pools to capture more rewards than they would running just one — even though the protocol's design assumes those pools belong to different operators.
Today, registering a pool costs about 500 ADA of refundable deposit. The protocol cannot tell on-chain whether two pools belong to the same person, unless that person declares it. This is how Cardano ends up with 449 productive pools but only 83 distinct entities behind them (POL.O5.F1) — the protocol target says ~500 slots, the reality says fewer than 100 hands.
CIP-0050's pledge cap is, at its core, an anti-Sybil instrument. The reasoning: if every pool needs its own pledge to earn rewards, then splitting one pool into N copies costs N times the pledge. Sybil becomes capital-bound, not just registration-bound.
This is the intuition the proposal's advocates build their case on. It is correct as far as it goes — and the diagnostic agrees with the mechanics. The disagreement that follows is about who on mainnet actually pledges under the new rule, and who ends up paying the cost regardless.
3. Assessment — validated problem, root-level fix first
1. The cap is mechanically sharp on pledge-as-signal — zero pledge, zero reward.
A zero-pledge pool earns zero reward; a fleet split across $N$ pools earns the same total cap as one. Both properties hold by algebra, not by behavioural assumption — pledge becomes a binding constraint on the reward-eligible stake.
This is the sharpest pledge-as-signal expression in the candidate bundle, and the only one that makes pool-splitting strictly revenue-neutral at the pool level. → The cap as pledge-as-signal — full mechanism
2. The change is too radical — it removes V1 rewards from a large majority of currently-productive pools without fixing the root cause in the formula.
At $L = 100$ and the stake-weighted-median retail pledge ratio of 0.07 %, the cap binds at $0.07\sigma$ and pool reward drops to ~7 % of its V1 baseline; 78 % of staked ADA sits in pools below the 1 % compliance threshold. The custodial CEX / IVaaS segment — 21 % of productive stake — cannot self-pledge at all and collapses to zero reward by construction. ~84 % of productive stake — including pools that produce blocks reliably and serve delegators well — sees a material cut.
And the mechanism that produces today's broken pledge signal — the bonus function A(ν, π) inside the SL-D1 reward envelope — is left entirely untouched. The σ′ clip is a new gate before the formula runs; it does not repair what A does to the pledge signal once a pool is past the gate. → Too radical, root cause unfixed — full quantification
3. Most of the pool pot returns to reserve and network-wide delegator yield collapses.
Today, the diagnostic shows ~56 % of the pool pot already returns to reserve unused every epoch — the single largest addressable inefficiency in the system (POL.O1.F3: 95.6 % of the pledge-bonus budget already wasted). CIP-0050 at L = 100, applied to today's pledge distribution, clips eligible σ′ on ~84 % of productive stake — collapsing distribution efficiency from 44 % to ~8 % and pushing return-to-reserve to ~92 %. Network-wide stake-weighted delegator yield drops from ~2.27 % to ~0.44 % — an 80 % collapse.
The closing-incentive-gap pathology the diagnostic flags as the largest addressable inefficiency in the system gets dramatically worse, not better. → Pool pot returns to reserve — yield collapses
The remainder of the document walks the proposal in three steps: §4 quantifies what changes on mainnet today; Appendix A unpacks the formula, the three binding regimes, and the four operator response paths; Appendix B documents the per-finding evidence with verdict tags.
4. What it does to mainnet today
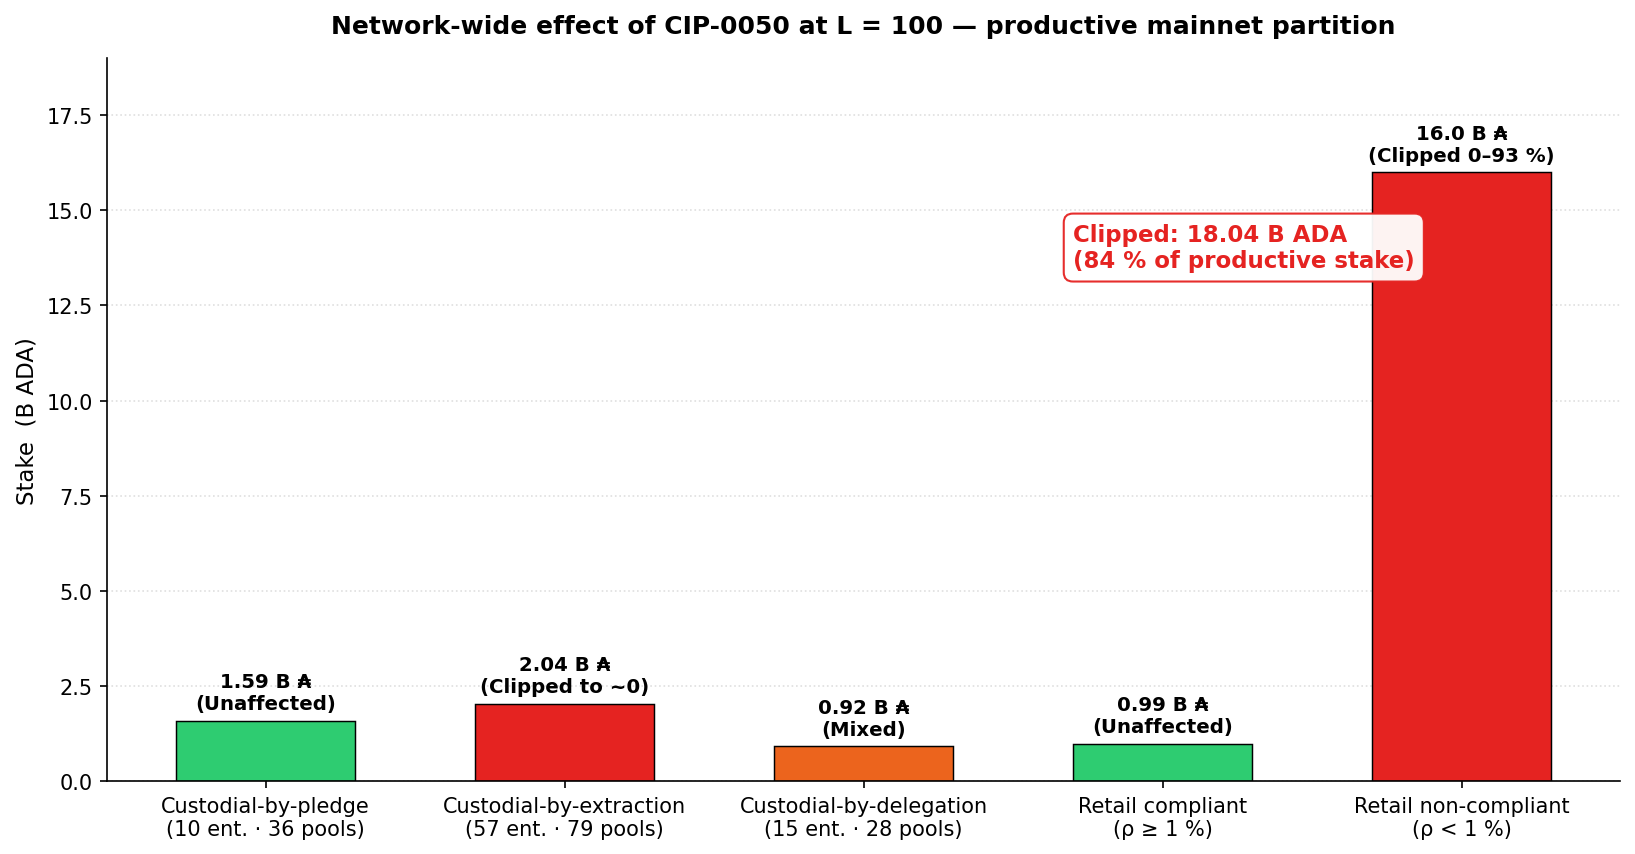
CIP-0050.4.1 — At the proposal's recommended $L = 100$, ~18 B ADA — 84 % of productive stake — sits in pools that would be clipped or collapsed. Red = clipped, green = unaffected, orange = mixed.
Segment
Stake
Reward effect at L = 100
Custodial-by-pledge (treasury operators)
1.59 B
Unchanged — already compliant
Custodial-by-extraction (CEX / IVaaS)
2.04 B
Collapses to ~0 — funds are custodied retail balances; no self-pledge possible
Custodial-by-delegation
0.92 B
Mixed
Retail, pledge ≥ 1 %
~0.99 B
Unchanged
Retail, pledge < 1 % (median 0.07 %)
~16.0 B
Clipped 0–93 %
84 % of productive stake clipped or collapsed at the long-run target is the headline asymmetry.
The CIP's staged ramp ($L = 10\,000 \to 1\,000 \to 100$) is meant to soften this. The ramp bets that operators raise pledge between steps.
The diagnostic finds little evidence that operators do this. And the 2.04 B custodial-by-extraction segment cannot pledge at all — they hold custodied retail funds, not their own capital.
What the proposal's own forward-looking simulation shows.
The CIP-0050 advocates published a forward-looking simulation using the Edinburgh Reward-Sharing Simulation engine, projecting network behaviour at $k = 2\,000$. Two of their scenarios are directly comparable:
Scenario
$a_0$
$L$
Independent entities at $k = 2\,000$
Baseline (current rules, no L)
0.3
—
~159
CIP-0050 active
0.3
10–10 000
~160
A one-entity improvement in their own model. The advocates frame this as "network pledge rises slightly under CIP-0050" — accurate. But the headline measure of decentralisation (the count of distinct entities holding the network) is essentially flat when L is the only thing that changes.
The larger improvement they cite (~116 entities at $a_0 = 0.1$ versus ~160 at $a_0 = 0.3$) comes from restoring a_0 to 0.3 — its current mainnet value. That part of the gain is already in place; it is not a CIP-0050 contribution.
Read together with the mainnet snapshot above (~84 % of productive stake clipped or collapsed at L = 100), the picture is consistent: the cap reshuffles money among the same handful of large operators that produce today's concentration. It does not break the concentration regime; it just changes who qualifies for the V1 reward.
Mechanism in detail (formula, three scenarios, the cliff at the pledge-ratio threshold, operator decision tree, deployment ramp) — Appendix A
Full findings list (S1 mechanical sharpness, S2 too radical / root cause unfixed, S3 entity-level gap) — Appendix B
Origin, V2-milestone mapping, and diagnostic-finding anchors — Appendix C
Appendix A — Mechanism in detail
This appendix gives the full mechanical decomposition of CIP-0050: the formula, the binding regimes, three worked scenarios, and the operator/delegator response surface. The opener summarises the conclusions; this appendix carries the derivations and figures that back them.
A.1. The formula
CIP-0050 modifies the reward-eligible stake $\sigma'$ entering the SL-D1 reward function (full treatment in pools-distribution §2.3):
$$\sigma'^{(50)}_{i} = \min\!\left(\sigma_{i},\ \frac{1}{k},\ L \cdot p_{i}\right)$$
Symbols — inherited from the SL-D1 formula as simplified in the sub-flow. The RSS protocol normalises stake and pledge as fractions of circulating supply, not absolute ADA. Under that convention:
$\sigma_i$ — pool $i$'s total stake (pledge + delegated), as a fraction of circulating supply.
$p_i$ — pool $i$'s pledge, as a fraction of circulating supply.
$k$ — target-pool count protocol parameter.
$z_0 = 1/k$ — the saturation threshold as a fraction of circulating supply. At $k = 500$ and today's mainnet supply, $z_0 \cdot \text{Supply} \approx 77$ M ADA in absolute terms.
$L$ — new leverage cap, dimensionless ($L \geq 1$).
The reward curve is expressed in two normalised coordinates (from pools-distribution §2.3):
$\nu = \sigma / z_0$ — stake saturation level: what fraction of one fully-saturated V1 pool the total stake represents. $\nu = 1$ means the pool is at V1 saturation; $\nu > 1$ means oversaturated.
$\pi = s / \sigma$ — within-pool pledge ratio: the fraction of the pool's stake the operator commits as their own. $\pi = 0$ means hollow pool; $\pi = 1$ means full self-pledge.
These are independent coordinates over $[0, 1] \times [0, 1]$. The pool reward is $\hat f'(\nu, \pi, \bar p) = \bar p \cdot P_{\max} \cdot E(\nu, \pi)$ where $P_{\max} = R/k$ (reward ceiling) and $E(\nu, \pi)$ is the envelope function (see pools-distribution §2.3).
CIP-0050 in normalised coordinates. Substituting $\sigma = \nu z_0$ and $p = s = \pi \nu z_0$ into the CIP formula and dividing by $z_0$:
$$\nu'^{(50)}_{i} \;=\; \min\!\left(\nu_{i},\ 1,\ L \cdot \pi_{i} \cdot \nu_{i}\right) \;=\; \nu_{i} \cdot \min\!\left(1,\ \tfrac{1}{\nu_{i}},\ L \cdot \pi_{i}\right)$$
For pools below or at V1 saturation ($\nu \leq 1$) the second term $1/\nu \geq 1$ is dominated, so the formula simplifies to $\nu' = \nu \cdot \min(1, L \cdot \pi)$. The reward becomes $\hat f' = \bar p \cdot P_{\max} \cdot E(\nu', \pi)$.
Reading the formula — the three binding cases:
Constraint
What it does
When it binds
$\nu$ (or $\sigma$)
The pool's actual total-stake saturation
Not binding by itself — it is the target $\nu'$ starts from
$1$ (or $1/k$)
The V1 saturation cap — same as today
When the pool is at or above saturation ($\nu \geq 1$, i.e. $\sigma \geq z_0 \approx 77$ M ADA)
$L \cdot \pi \cdot \nu$ (or $L \cdot s$)
New — cap proportional to absolute pledge
When the within-pool pledge ratio is too low: $L \cdot \pi < 1$, i.e. $\pi < 1/L$
For $L = 100$: the new cap binds whenever the pool's within-pool pledge ratio $\pi$ falls below 1 %. Above 1 %, CIP-0050 is invisible; at or below 1 %, the effective saturation level $\nu'$ is clipped to $L \cdot \pi \cdot \nu$ and the reward shrinks accordingly. The compliance condition reduces to a direct threshold on the pledge ratio.
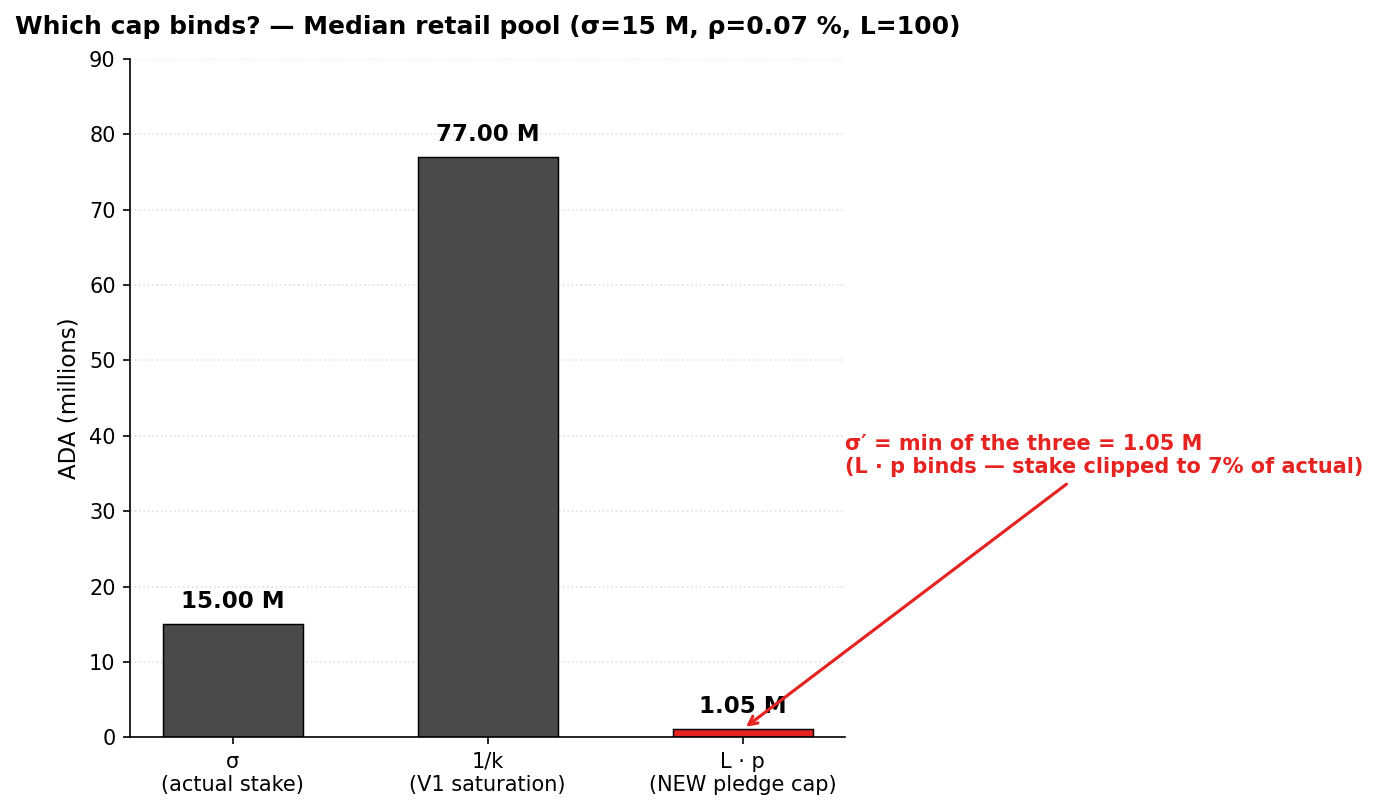
Visualising the three caps — which one wins, for the median retail pool.
A.1 — Three competing caps for the median retail pool ($\sigma = 15$ M, $p = 10.5$ k): the new pledge-leverage cap $L \cdot p = 1.05$ M ADA wins the min, slicing the reward-eligible stake to 7 % of the pool's actual size.
Design surface.
Property
Value
New parameter
$L$ (pledgeLeverage), dimensionless
Range
$1 \leq L \leq 10\,000$
CIP-recommended sweet spot
$L \in [10, 100]$
Layer
Stake-cap (applied before reward curve)
Fee-layer split
Unchanged
Hard fork
Required (new ledger variable)
Re-registration
Not required
Governance surface
1 scalar
A.2. Three worked scenarios
The three min-arguments ($\nu$, 1, $L\cdot\pi\cdot\nu$) — equivalently $(\sigma, 1/k, L\cdot s)$ in absolute units — carve the state space into three regimes. Each scenario below shows the four quantities $(\sigma, s, \nu, \pi)$ alongside the binding cap. $z_0 \approx 77$ M ADA at today's mainnet, $L = 100$.
Scenario A — Compliant small pool (within-pool pledge ratio $\pi \geq 1/L = 1\,\%$).
Quantity
Value
Total stake $\sigma_{\text{abs}}$
5 M ₳
Pledge $s_{\text{abs}}$
100 k ₳
Stake saturation level $\nu = \sigma/z_0$
0.065 (6.5 % of V1 saturation)
Pledge ratio $\pi = s/\sigma$
0.020 (2 %) — at or above $1/L = 1\,\%$
$L \cdot \pi$
2.0 — greater than 1, so $L\cdot\pi\cdot\nu = 2\nu > \nu$, does not bind
$\nu' = \min(\nu, 1, L\cdot\pi\cdot\nu)$
$\nu$ — cap inactive
Pool reward
V1 baseline, unchanged
Scenario B — Zero-pledge mainnet-median pool (within-pool pledge ratio 0.07 %).
Quantity
Value
Total stake $\sigma_{\text{abs}}$
15 M ₳ (Healthy tier)
Pledge $s_{\text{abs}}$
10.5 k ₳ (stake-weighted median per POL.O2.F1)
$\nu = \sigma / z_0$
0.195 (19.5 % of V1 saturation)
$\pi = s/\sigma$
0.0007 (0.07 %) — far below $1/L = 1\,\%$
$L \cdot \pi$
0.07 — less than 1, so $L\cdot\pi\cdot\nu = 0.07\,\nu < \nu$, cap binds
$\nu' = \min(\nu, 1, L\cdot\pi\cdot\nu)$
$\nu' = L\cdot\pi\cdot\nu = $ 0.0136 (saturation level clipped to 1.4 % of V1)
1.3 — greater than 1, so $L\cdot\pi\cdot\nu = 1.3 > 1$, the V1 cap (1) wins
$\nu' = \min(\nu, 1, L\cdot\pi\cdot\nu)$
$\nu' = $ 1.0 (V1 saturation cap binds)
Pool reward
V1 baseline, unchanged
The core consequence. For a given $L$, the reform partitions the pool population by a single threshold on the within-pool pledge ratio $\pi$: at or above $1/L$, CIP-0050 is inactive; below it, the effective saturation level $\nu'$ is clipped to $L \cdot \pi \cdot \nu$ and the pool reward scales with the clip ratio $\nu'/\nu = L \cdot \pi$. Scenarios A and C both illustrate "cap does not bind" but for different reasons — A is compliant on pledge ratio; C is bounded by V1 saturation before the pledge cap can bite.
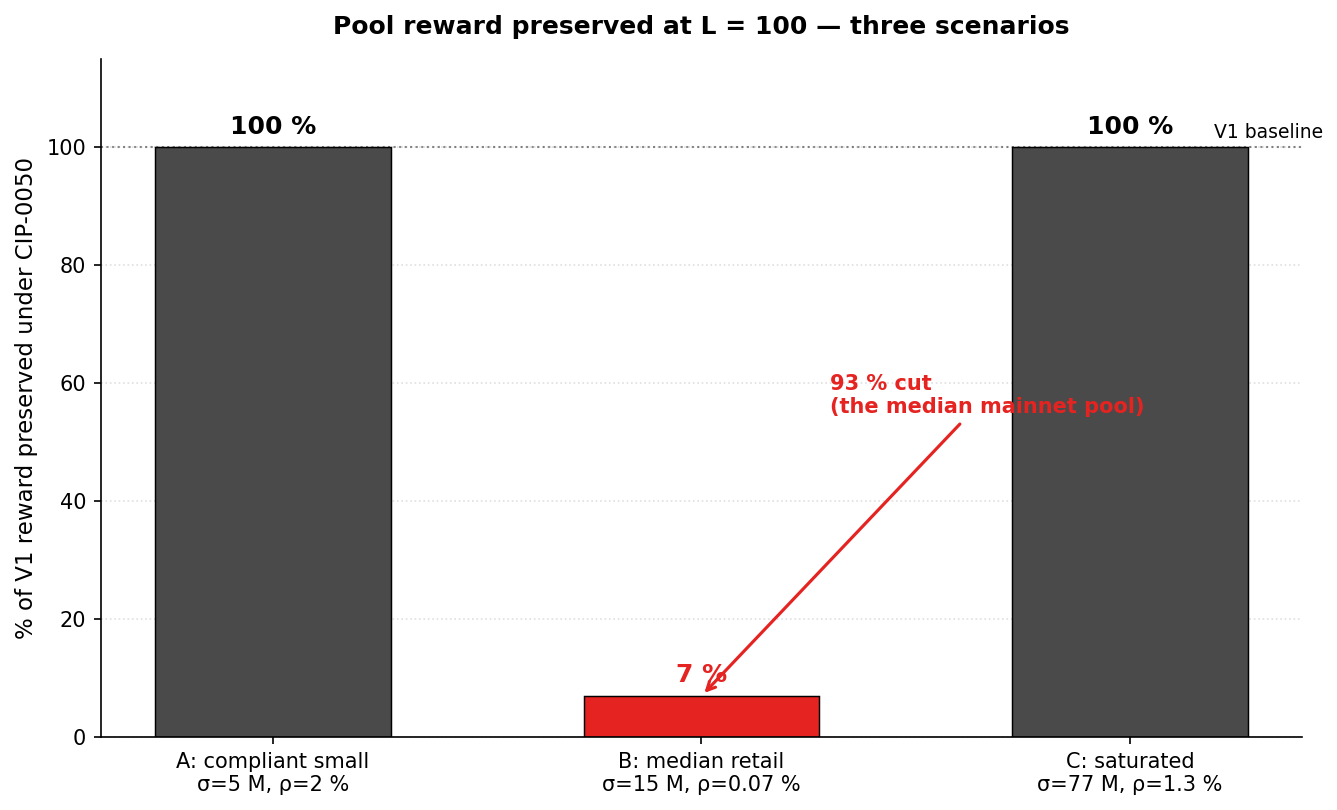
The three scenarios side by side.
A.2 — Reward fraction preserved across the three scenarios at $L = 100$: compliant (A) and saturated (C) pools keep 100 %; the zero-pledge median retail pool (B) drops to ~7 % — a binary line at $\pi = 1/L$.
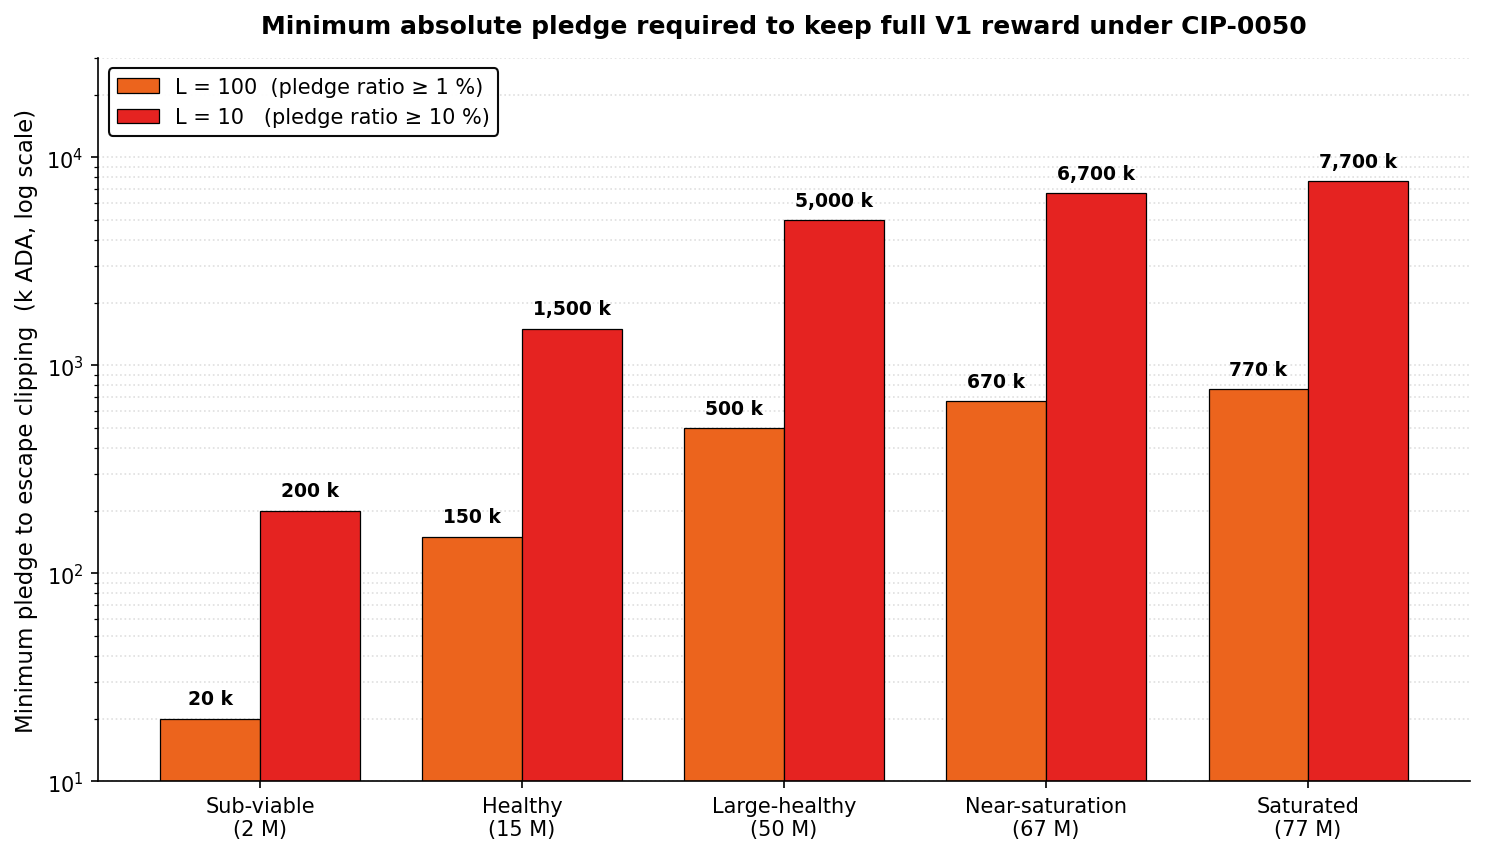
A.3. How much pledge does an operator need
For any pool with stake $\sigma$, the minimum pledge to escape clipping at $L = 100$ is:
Worked across the canonical nine-tier taxonomy that the diagnostic uses to bracket pools by stake size — running from Dormant (≈ 50 K ADA, too small to produce blocks reliably) through Sub-block, Sub-reliable, Healthy, Large healthy, Near-saturation, Saturated (~77 M ADA, at the V1 cap) to Oversaturated. Full definitions in pools-distribution §4.1.3; the seven middle tiers are the productive range used here:
Tier
Representative σ
Minimum pledge to escape clipping at $L = 100$
Minimum pledge at $L = 10$
Dormant
50 K
500 ₳
5 000 ₳
Sub-block
500 K
5 000 ₳
50 000 ₳
Sub-reliable
2 M
20 000 ₳
200 000 ₳
Healthy
15 M
150 000 ₳
1 500 000 ₳
Large healthy
50 M
500 000 ₳
5 000 000 ₳
Near-saturation
67 M
670 000 ₳
6 700 000 ₳
Saturated
77 M
770 000 ₳
7 700 000 ₳
At $L = 100$, a Healthy-tier pool needs **150 k ADA** (≈ \$37 k USD at \$0.25/ADA) to escape clipping. A Saturated-tier pool needs 770 k ADA (≈ \$192 k USD). At the tighter $L = 10$ the CIP considers, the pledge requirement is **10× higher** — a Healthy pool would need 1.5 M ADA (≈ \$375 k USD).
A.4. The cliff at the pledge-ratio threshold
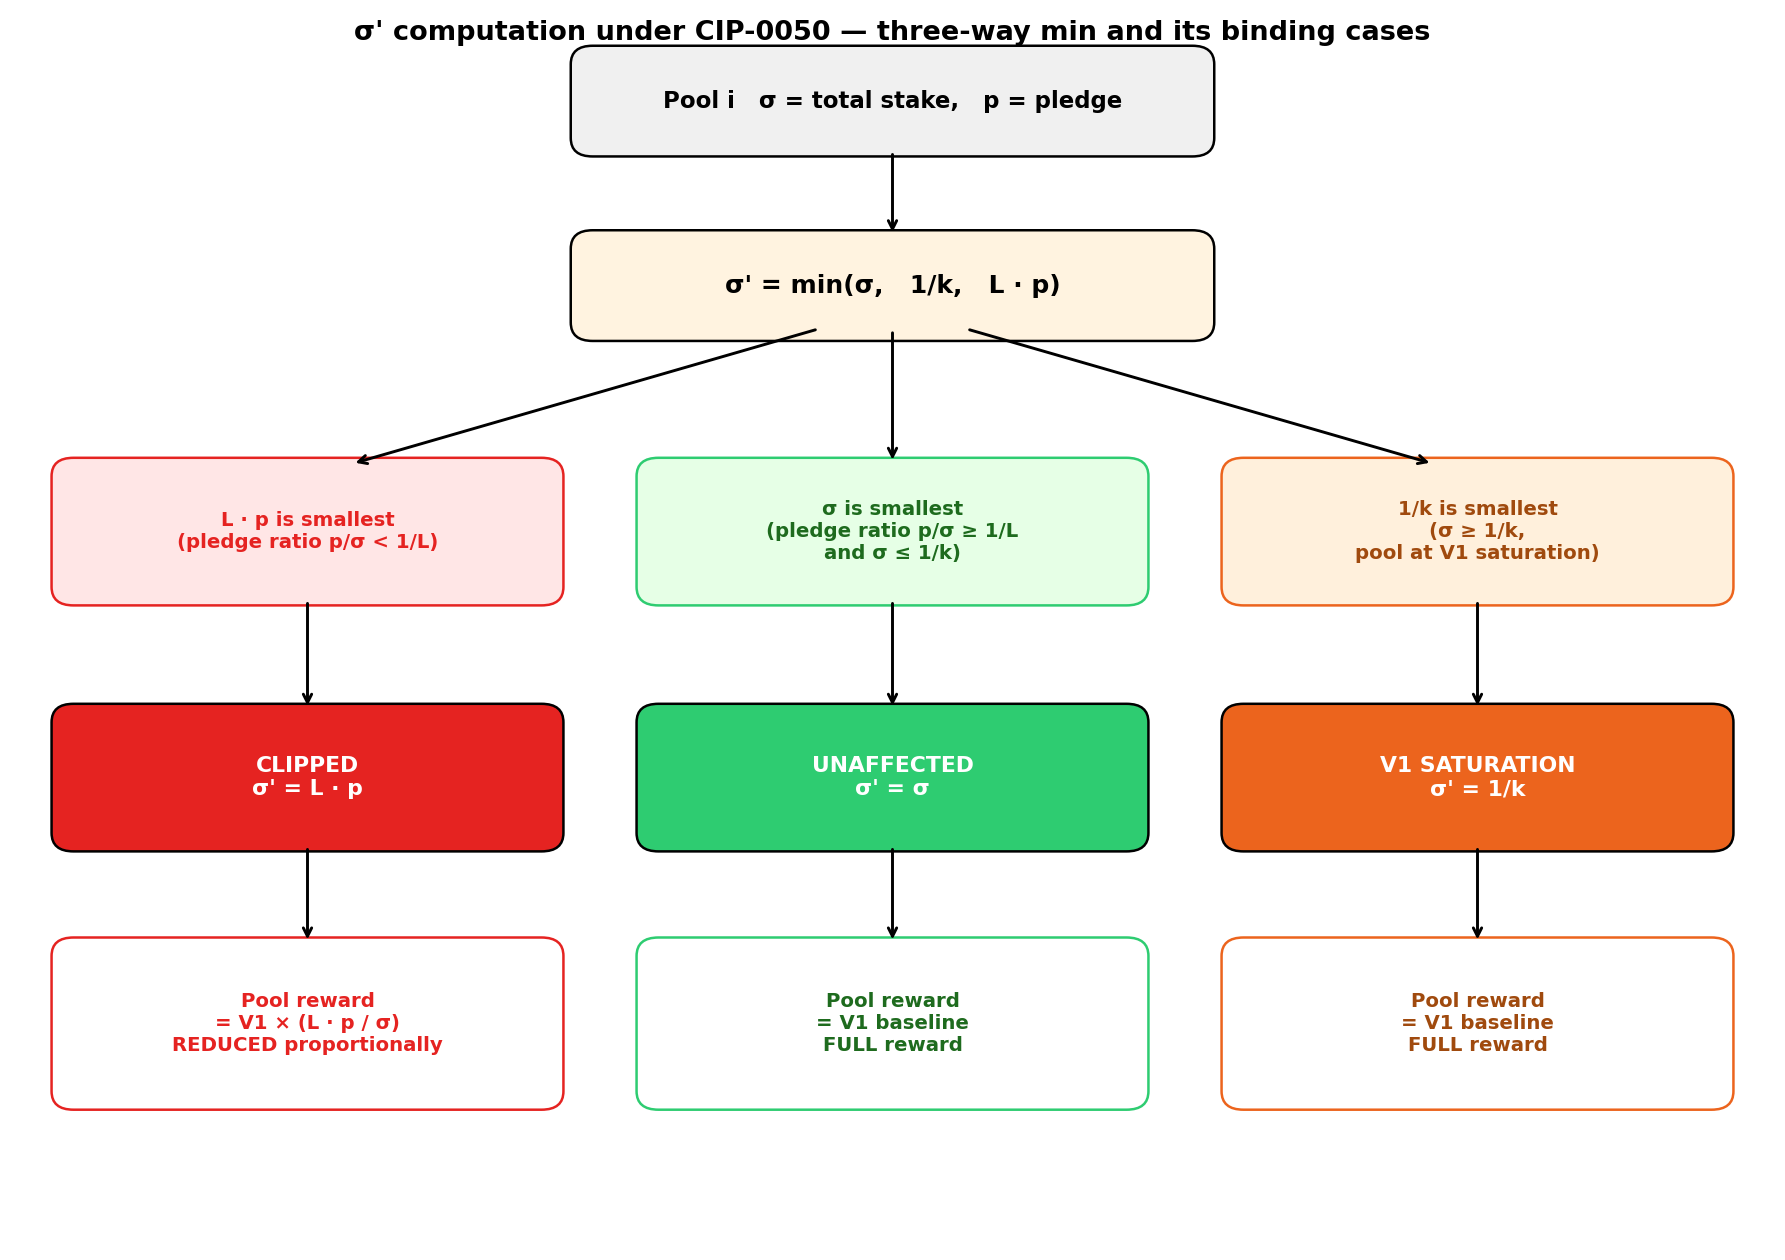
How the σ' is computed — the three-way min.
A.3 — Decision flow for the three-way min computing $\sigma'$: each pool falls into one of three regimes — Clipped (pledge cap binds), Unaffected (actual stake binds), or V1 saturation ($1/k$ binds, CIP-0050 is a no-op).
Reward preserved vs pledge ratio — the cliff shape at different $L$ values.
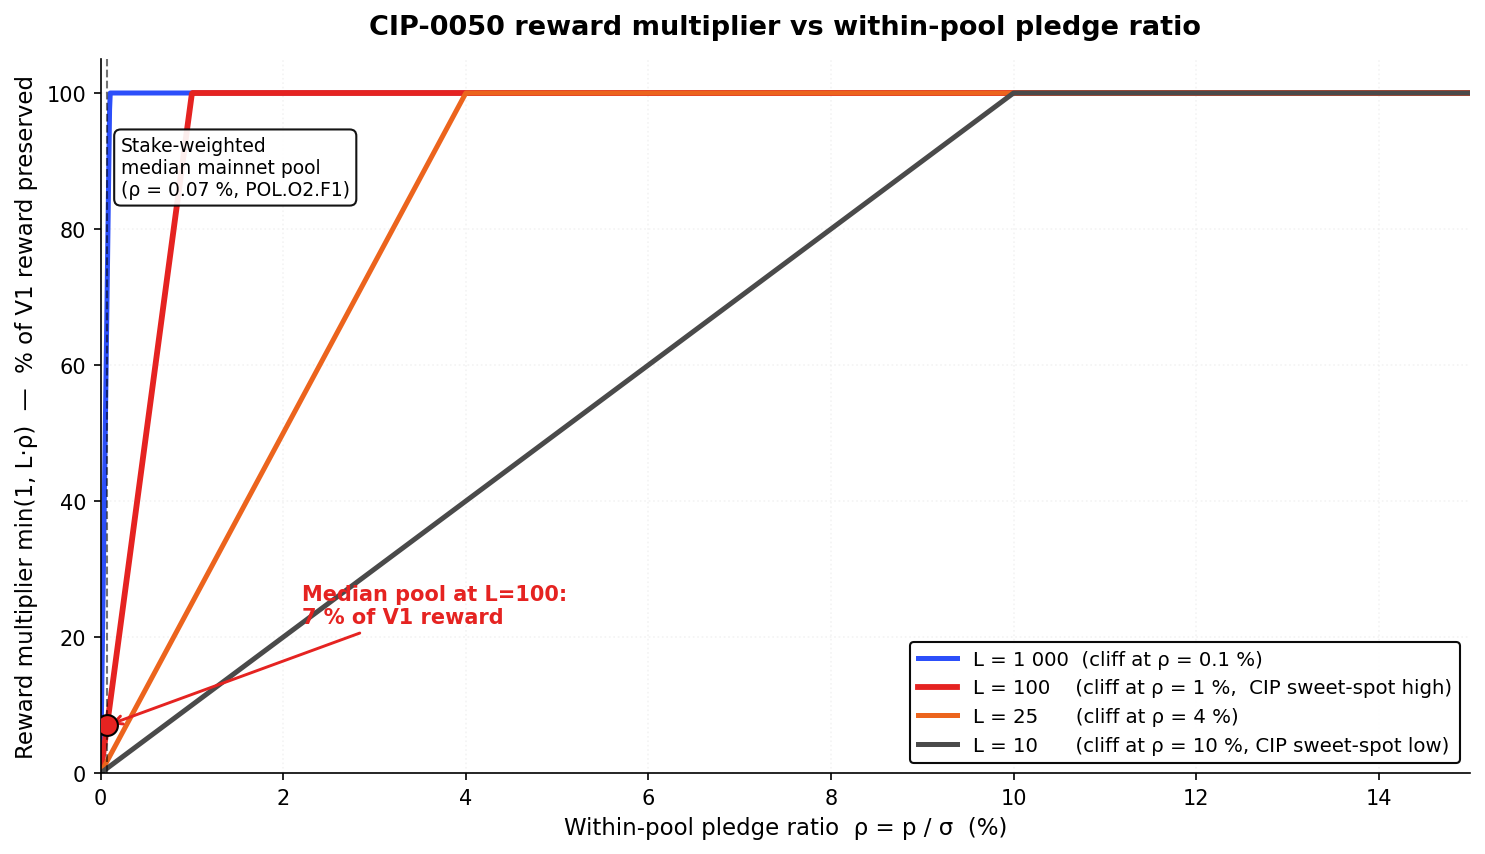
A.4 — Reward fraction preserved as a function of within-pool pledge ratio $\pi$ for four leverage values: linear ramp up to the cliff at $\pi = 1/L$, flat at 100 % above. Median-pool marker at $\pi = 0.07\,\%$ falls in the clipped regime for every $L \geq 10$.
The stake-weighted-median retail pledge ratio is 0.07 %. That is marked on the X axis above and falls in the clipped regime at every $L \geq 10$. At the CIP's recommended $L = 100$, the median pool preserves only 7 % of its V1 reward.
The ramp seen from the median mainnet pool. Reading the same curve at the median pledge ratio (π = 0.07 %) as the CIP's staged $L$ tightens:
Leverage $L$
Cliff threshold (minimum compliant pledge ratio)
Median-pool reward fraction (π = 0.07 %)
$L = 10\,000$ (near-inactive)
0.01 %
~100 % (essentially no effect)
$L = 1\,000$
0.1 %
~70 %
$L = 100$ (CIP sweet-spot high end)
1 %
~7 %
$L = 25$
4 %
~1.75 %
$L = 10$ (CIP sweet-spot low end)
10 %
~0.7 %
Table A.4 — Reward fraction preserved at the median retail pledge ratio at each step of the CIP's recommended ramp.
A.5. Structural properties (theorems, not predictions)
Four properties follow directly from the formula — independent of any behavioural assumption.
$N$ pools sharing pledge $P$ give the same total cap $L \cdot P$ as one pool — see Appendix B.1 — F2
Monotonicity in pledge
$\partial \sigma'/\partial p \geq 0$ on the binding branch — higher pledge is strictly (weakly) rewarded
Price invariance
$L$ is dimensionless; the cap is a ratio — robust to ADA/USD price moves
Table A.5 — The four structural properties of the CIP-0050 σ′ rule. The first two are the design's main strengths and are quantified at finding-level in Appendix B.1.
A.6. What this means for different operator types
A concrete example. Consider three mainnet operator archetypes (profiles inferred from operator-delegator §4.3.3):
Operator type
Pool stake σ
Self-pledge p
Pledge ratio
σ' at L = 100
V1 reward preserved
What they must do to stay whole
Everstake-style 11+ MPO (per pool)
33.4 M ₳
~30 k ₳ (0.09 %)
0.09 %
3.0 M ₳
9 %
Add ~304 k ADA pledge per pool — for an 11-pool fleet, ~3.3 M ADA total
Community single-pool (typical retail)
11.4 M ₳
~8 k ₳ (0.07 %)
0.07 %
0.8 M ₳
7 %
Add ~106 k ADA pledge — ≈ \$27 k USD at \$0.25/ADA
Cardano Foundation / private treasury
77 M ₳
large (e.g. 60 M ₳ at 78 % ratio)
≥ 1 %
77 M ₳
100 %
Nothing — already compliant
The operator-level implication. Compliance under CIP-0050 at $L = 100$ requires the operator to lock 1 % of the pool's total stake as pledge. Three populations face very different economics:
Custodial-by-extraction (CEX / IVaaS) — cannot self-pledge (funds are custodied retail balances, legally separate from operator capital). σ collapses to σ' = 0. Their only recourse is to attract pledge-holding partners or exit.
Retail small-pool operators — the median pool needs hundreds of thousands of ADA in additional self-pledge. Most operators in this segment do not have this capital liquid. Their realistic options are: (a) shrink the pool by refusing delegation beyond $L \cdot p$, (b) accept the reward cut, (c) exit.
Treasury / foundation pools — already compliant by construction. The reform is a no-op for this segment.
The reform's signal to the network is: "to operate a pool that captures delegation, you must prove 1 % of the pool's stake in personal capital". That signal is clean in principle — it is exactly the pledge-as-binding-commitment V2 §3.2 asks for — but it acts as a new gate before the reward formula runs, while leaving the formula itself (the A(ν, π) bonus function that produces today's non-pledging equilibrium) untouched (see Appendix B.2 — Too radical, root cause unfixed).
Minimum pledge to escape clipping, by tier.
A.6 — Minimum pledge needed per tier to escape clipping: a Healthy pool requires 150 k ADA at $L = 100$ and 1.5 M ADA at $L = 10$ — linear in pool stake and in $1/L$.
The pool-size sweep at median pledge. At the stake-weighted-median pledge ratio of 0.07 %, the fraction of reward preserved is the same for every pool size (7 %) — but the absolute stake clipped scales with σ:
Tier
σ
Pledge at 0.07 % ratio
$L \cdot p$ (at $L = 100$)
σ'
V1 stake clipped away
Sub-reliable
2 M
1.4 k ₳
140 k
140 k
1.86 M ₳ (93 %)
Healthy
15 M
10.5 k ₳
1.05 M
1.05 M
13.95 M ₳ (93 %)
Large healthy
50 M
35 k ₳
3.5 M
3.5 M
46.5 M ₳ (93 %)
Near-saturation
67 M
47 k ₳
4.7 M
4.7 M
62.3 M ₳ (93 %)
Saturated
77 M
53.9 k ₳
5.39 M
5.39 M
71.6 M ₳ (93 %)
The relative impact is uniform (7 % preserved everywhere at the same pledge ratio), but the absolute "stake in exile" grows linearly with the pool. A Saturated-tier pool with the median pledge ratio loses 71.6 M ₳ of reward-earning stake — the bulk of its delegation effectively becomes unrewarded overnight unless the operator raises pledge.
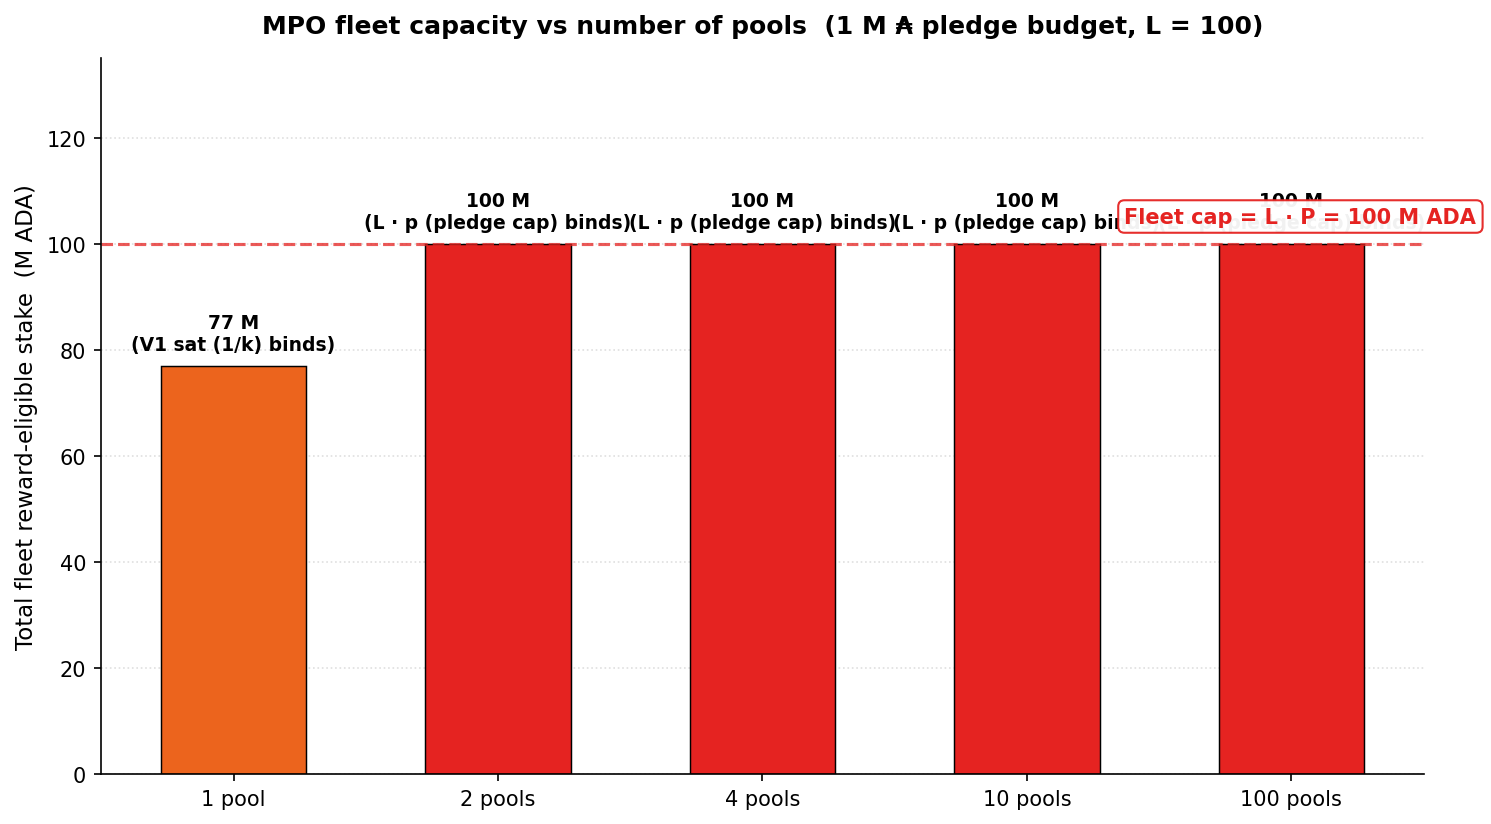
MPO fleet example — the revenue-neutrality of pool-splitting. Consider an operator with 1 M ₳ of pledge capital and a fleet of delegation-attracting pools.
A.7 — Fleet reward-eligible capacity vs pool count for an operator with 1 M ADA pledge: capacity plateaus at $L \cdot P =$ 100 M ADA once $L \cdot p < 1/k$, making pool-splitting revenue-neutral.
Configuration
Pledge per pool
σ' per pool
Binding cap
Total fleet σ'
1 pool
1 000 000 ₳
up to 77 M
V1 saturation ($1/k$)
77 M
2 pools
500 000 ₳
50 M each ($L \cdot p$ binds at 50 M < 77 M)
$L \cdot p$
100 M
4 pools
250 000 ₳
25 M
$L \cdot p$
100 M
10 pools
100 000 ₳
10 M
$L \cdot p$
100 M
100 pools
10 000 ₳
1 M
$L \cdot p$
100 M
Above the threshold where $L \cdot p < 1/k$, fleet capacity = $L \cdot P$ constant. The MPO fleet-expansion incentive disappears at the pool level.
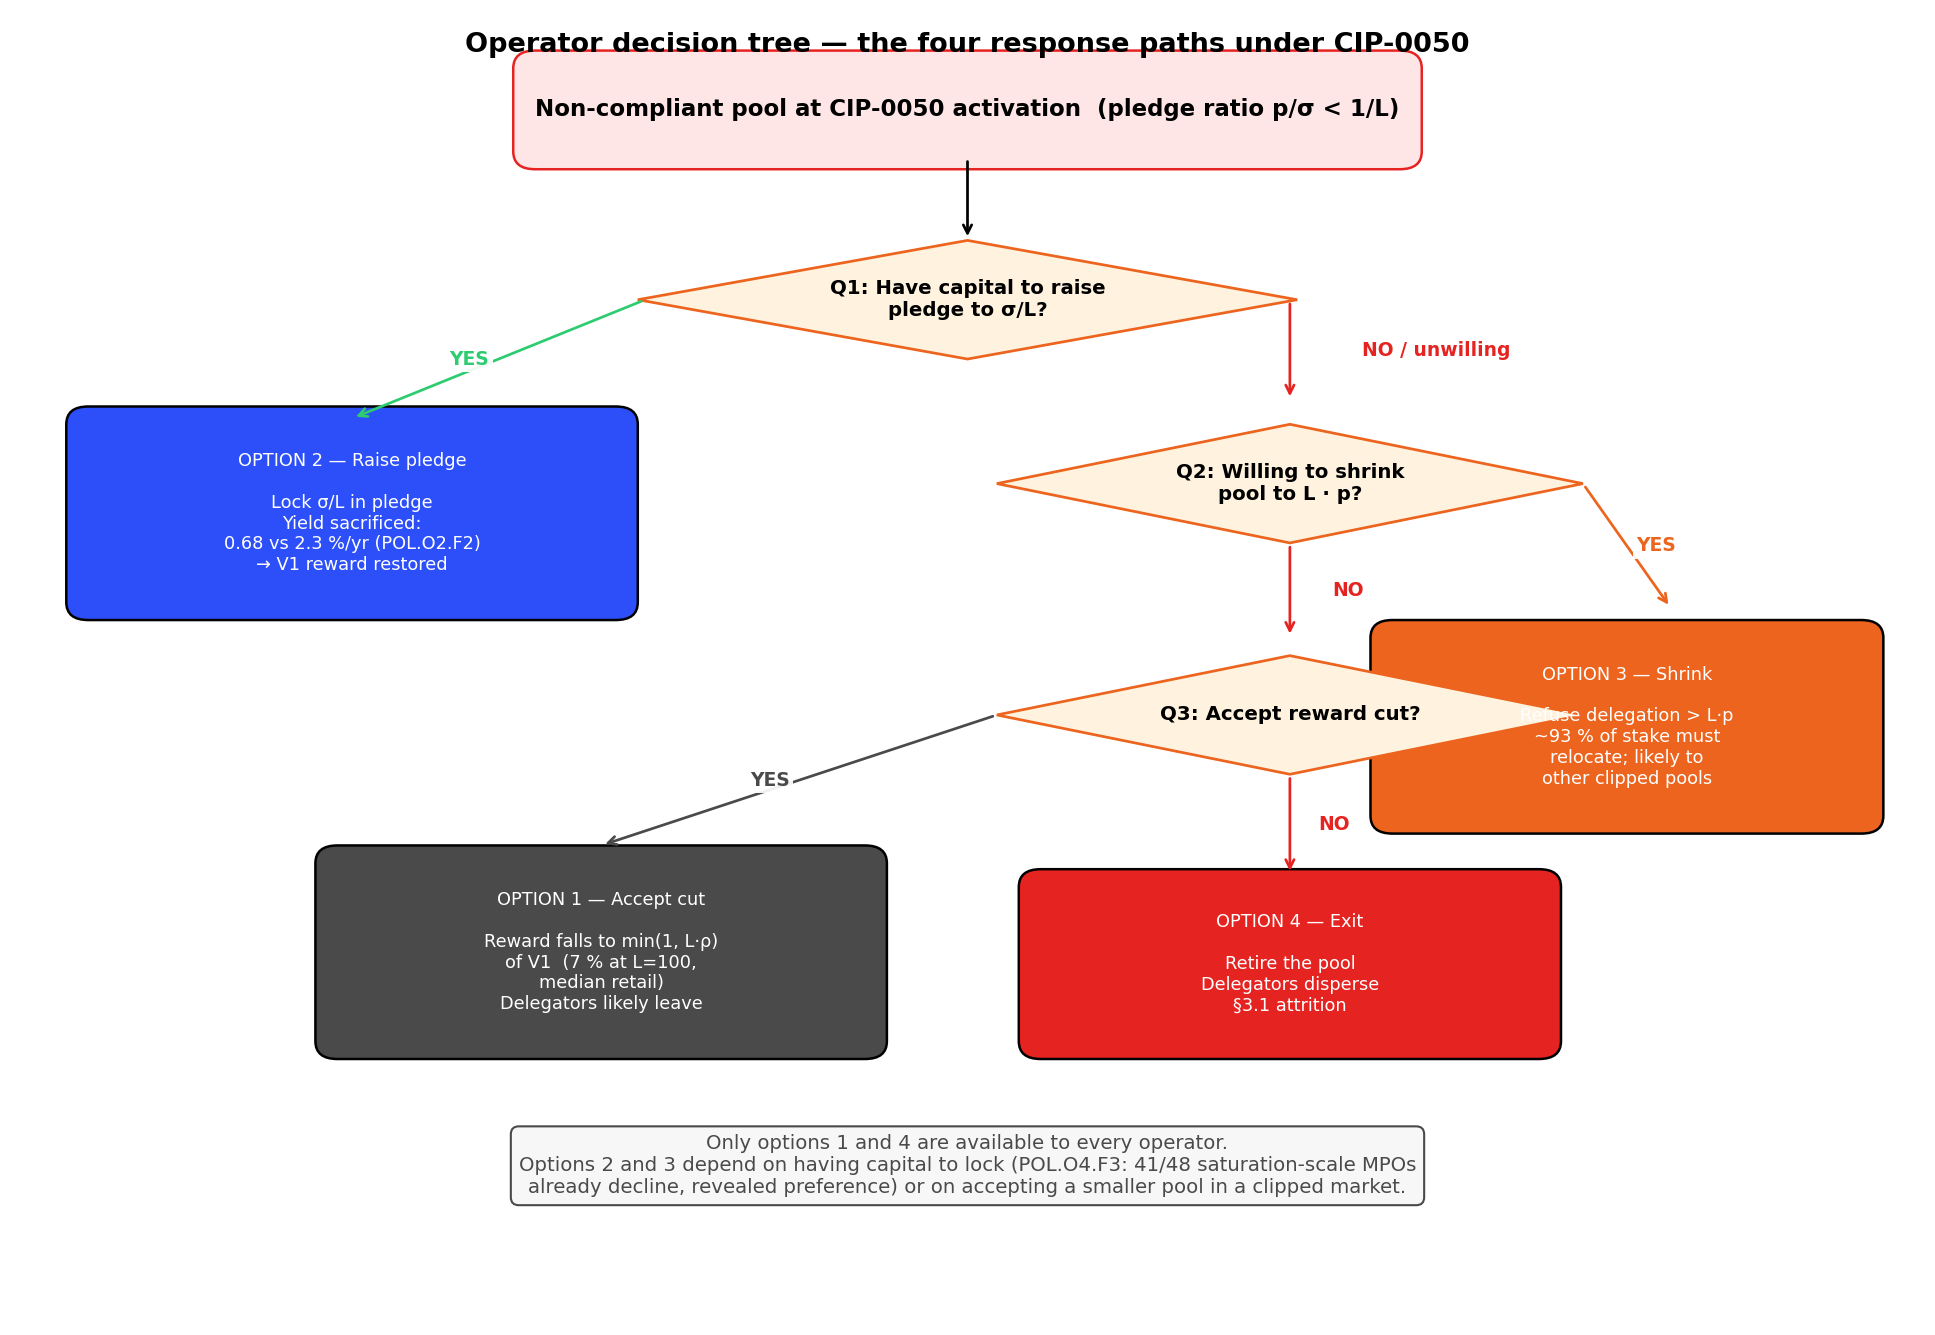
A.7. Operator decision tree
A.8 — Four response paths an operator faces under the new cap (accept the cut, raise pledge, shrink, exit), gated by the question "do you have $1/L$ of pool stake in liquid capital to lock?".
A zero-pledge operator facing the cap has four response paths. Using the Healthy-tier 15 M ₳ pool as the reference (10.5 k ₳ pledge = 0.07 % ratio):
Option
Action
Outcome
Feasibility
1 — Accept the cut
Do nothing
Pool reward falls to 7 % of V1; operator take and delegator ROS both cut proportionally (fee split is unchanged)
Always available; signals to delegators "this pool no longer competes"
2 — Raise pledge to compliance
Add ~140 k ₳ pledge to reach 1 % ratio (~\$35 k USD at \$0.25/ADA)
Cap no longer binds; pool reward restored to V1
Feasible only for operators with this much liquid capital; opportunity cost = pledge yield (0.68 %/yr) vs passive delegation (2.3 %/yr) — negative on that axis alone (POL.O2.F2)
3 — Shrink the pool
Refuse delegation beyond $L \cdot p = 1.05$ M
Pool stays compliant but at a fraction of its current size; ~14 M ₳ of former delegation must relocate
Feasible but destructive: delegators seek new pools that are themselves likely clipped
4 — Exit
Retire the pool
Stake and delegators both dispersed
Feasible; contributes to the small-pool attrition V2 §3.1 is meant to prevent
Only options 1 and 4 are accessible to every operator. The diagnostic answers — for 78 % of stake, and for 42 of 48 saturation-scale MPOs — no, by revealed preference — to the central question "do you have 1/L of your pool's stake in liquid capital willing to lock it?".
A.8. The delegator perspective
A delegator holding 10 000 ₳ in a pool that gets clipped experiences the cut as a per-ADA ROS reduction. Using the three scenarios:
Scenario
Pool σ
Pledge ratio
σ'/σ
Gross yield (ADA/yr per 10 k)
Net ROS after fee
Delegator yield change
A — Compliant
5 M
2 %
1.00
227 ₳
~2.25 %
Unchanged
B — Zero-pledge median
15 M
0.07 %
0.07
16 ₳
~0.14 %
Drops by ~93 %
C — Saturated high-pledge
77 M
1.3 %
1.00
227 ₳
~2.26 %
Unchanged
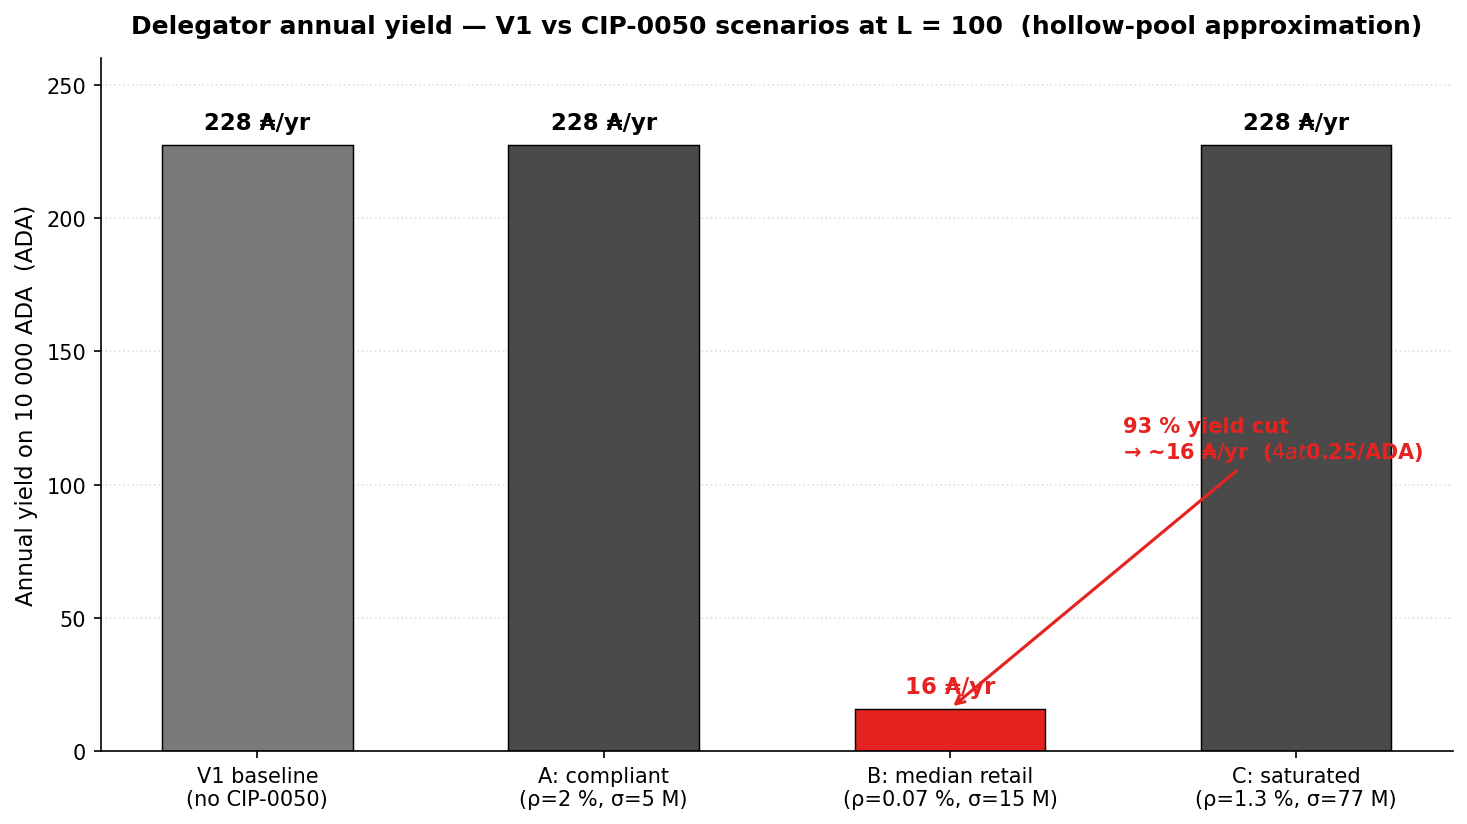
A delegator in Scenario B — a typical retail pool on mainnet today — would see their yield drop from ~227 ₳/yr to ~16 ₳/yr per 10 k ADA staked. On 10 k ADA over a year, that is the difference between \$56 vs \$4 at \$0.25/ADA.
A.9 — Annual yield on a 10 000 ADA stake across the three scenarios: compliant pools preserve ~227 ADA/yr; the zero-pledge median pool collapses to ~16 ADA/yr (a ~93 % cut).
At this level of compression, delegators have strong incentive to re-delegate — but per OPE.O7.F1, the observed delegator response to yield signals is not reliable, so whether the re-delegation actually occurs is the empirical open question (see Appendix B.3 — Pool pot returns to reserve, yield collapses).
A.9. The CIP's recommended deployment ramp
The CIP acknowledges that moving from today's regime (where pledge is cosmetic) to $L = 100$ is a shock and proposes a staged activation:
Stage
$L$
Cliff threshold
Rationale
Activation
10 000
0.01 %
Near-inactive — installs the parameter in the ledger; most pools already compliant
Stage 1
1 000
0.1 %
Mild clipping; operators can observe and adjust
Stage 2
100
1 %
CIP-recommended long-run target
Stage 3 (optional)
25
4 %
Tighter Sybil floor
The ramp's implicit assumption: each step gives operators time to adjust their pledge upward before the next step. The reform rests on the assumption that this adjustment occurs — otherwise the system moves through successive regressive states. Whether the adjustment actually happens is the empirical question analysed in Appendix B.2.
A.10. Composition with a k-raise — when does a stake-cap actually deconcentrate?
The proposal's advocates argue L works in synergy with raising k. Their logic, walked through plainly:
Today, raising k from 500 to a higher value just creates more pool slots that existing multi-pool operators absorb at near-zero marginal cost (the diagnostic confirms this — see cip-0082 §B.3);
With L active, splitting a fixed pledge across more pools shrinks each pool's reward envelope. Existing fleets cannot absorb the new slots without raising real pledge.
The mechanical part is correct. A stake-cap layer is a genuine precondition for a constructive k-raise. Without it, every k-raise to date has produced multi-pool absorption (the August 2020 k: 150 → 500 raise produced today's MPO landscape).
What the advocates' argument does not address is the population that gets stranded by the cap before any k-raise happens. At L = 100 today, ~84 % of productive stake earns rewards through pools that fall outside the cap. Raising k on top of that does not help any of those pools — they were already clipped. So under (CIP-0050 alone) + (k-raise) on today's mainnet:
the upper-tail concentration shifts toward operators with both real pledge and capacity for more pools — a small population in practice;
the small-pool tail still bleeds out: both operator income and delegator yield fall;
the custodial-by-extraction segment (~21 % of productive stake) still collapses, because the operators of those pools legally cannot self-pledge.
The deconcentration goal is reachable along this path only if a fee-layer viability instrument runs in parallel — something to keep the small-pool tail alive while the stake-cap pressures the upper tail and the k-raise opens new slots for new entrants. This is the fee-layer → stake-cap → k-recalibration sequencing the solution-evaluation conclusion names.
Without the fee-layer step, CIP-0050 + k-raise reaches a smaller productive population, not a more decentralised one.
Appendix B — Findings
Three cards below organise the analysis: what the cap actually delivers (S1), why it is too radical and leaves the root cause A(ν, π) unfixed (S2), and the macro-level damage to pool-pot distribution efficiency and network-wide delegator yield (S3).
S1
Synthesis 01 · 2 findings · the design-strength row
Mechanical sharpness on pledge-as-signal
2 findings
What the instrument actually delivers: zero-pledge pools earn nothing, pool-splitting is revenue-neutral. Both properties follow directly from the formula — they hold as algebra, not as predictions about how operators will react.
Zero-pledge hard break. For any pool with $\pi = 0$, the cap $L \cdot p$ evaluates to zero and clips the entire stake. A zero-pledge pool earns zero reward under CIP-0050. This is the sharpest possible expression of "pledge is a binding signal" — it converts a cosmetic yield nudge (~22 % gap at $a_0 = 0.3$) into a total reward cut-off. Direct delivery on V2 §3.2.
Pool-splitting is revenue-neutral. For an entity with pledge budget $P$ split across $N$ pools of equal pledge $p = P/N$, the total reward cap across the fleet is $N \cdot (L \cdot P/N) = L \cdot P$ — identical to what a single pool with the entire pledge would capture. The MPO fleet-expansion incentive disappears at the pool level under CIP-0050. Direct delivery on V2 §3.4 pool-level concentration.
Both properties hold by algebra, not by assumption about how operators will behave. That is what makes CIP-0050 the sharpest pledge-as-signal instrument in the bundle.
S2
Synthesis 02 · 3 findings
Too radical — clips most existing pools without fixing the root cause in the formula
3 findings
The cap removes V1 rewards from a large majority of currently-productive pools — without repairing the root cause of the broken pledge signal. The mechanism that produces today's non-pledging equilibrium is the bonus function A(ν, π) inside the SL-D1 reward envelope. CIP-0050 adds a new gate before the formula runs but leaves A itself untouched — so the assumptions the reform rests on do not actually flip.
A radical clip — ~84 % of productive stake at L = 100, including reliable producers. The median retail pool — pledge ratio 0.07 % (POL.O2.F1) — sees pool reward drop to ~7 % of its V1 baseline at L = 100 (Appendix A.3). 78 % of staked ADA sits in pools below the 1 % compliance threshold; ~84 % of productive stake is clipped or collapsed at the CIP's recommended endpoint (see the mainnet snapshot in §4). A pool can produce blocks reliably, serve delegators well, and operate with integrity — and still see a material cut, because the cap acts on a property of the operator, not on the pool's contribution to the network.
The custodial segment (~21 % of productive stake) cannot respond. Custodial-by-extraction entities (57 entities, 2.04 B ADA — see operator-delegator §4.3.3) hold custodied retail funds they legally cannot self-pledge. CIP-0050 clips their stake to zero; their reward collapses with no available adjustment. The affected population is exactly the one that cannot change its behaviour in response to the reform — so for this slice, the cap is not a signal, it is just a removal.
The root cause is A(ν, π), and CIP-0050 does not touch it. Pledge is cosmetic on mainnet today because the bonus function inside the SL-D1 reward envelope makes pledging a dominated strategy. Three structural pathologies in A produce that result — full anatomy in the stake-cap layer synthesis:
- a quadratic ν² size penalty that applies at every pledge ratio — small pools are crushed regardless of how committed the operator is;
- a non-monotonicity in π for sub-half-saturated pools — at ν ≈ 0.03 a 2 M operator earns 8.7× more bonus by pledging 51 % than by pledging 100 %; the formula explicitly incentivises small operators to under-commit;
- a cubic ν³ collapse at full self-pledge — at maximum commitment, a saturated operator earns 37 595× more bonus than a 2 M operator at the same pledge ratio.
Adding a σ′ clip before the formula runs changes who qualifies to earn the V1 reward; it does not repair what A does to the pledge signal once a pool is past the gate. The opportunity-cost data confirms the dominance relation persists: pledge yield is 0.68 %/yr at best vs ~2.3 %/yr passive (POL.O2.F2); 42 of 48 saturation-scale MPOs forfeit the bonus today (POL.O5.F3) and have no new mechanical reason to flip under CIP-0050.
Reading the three findings together.
CIP-0050 is a radical reform. It removes V1 rewards from a large majority of currently-productive pools — including pools that produce blocks reliably and serve delegators well. The reform then bets that operators will respond by pledging up, restoring rewards through compliance.
The diagnostic shows the bet does not hold, because the formula bottleneck A(ν, π) that produces today's non-pledging equilibrium carries through unchanged. The σ′ clip is a new gate before the formula; it does not repair the gradient inside the formula. So the dominance relation that already convinced 78 % of stake to ignore pledge survives the reform.
A genuine V2 stake-cap reform must redesign A itself — smoother operator onset at low ν, no design preference for fully-private pools, explicit reward for the balanced-commitment regime. See the stake-cap layer synthesis for the three properties an A-redesign must deliver. The σ′ clip is at most a complement to that redesign, not a substitute.
S3
Synthesis 03 · 3 findings
Most of the pool pot returns to reserve — network-wide delegator yield collapses
3 findings
The reform bets the operator population will pledge up. The diagnostic shows it will not — and as long as it does not, CIP-0050 forces a much larger share of the pool pot back to the reserve every epoch, accentuating exactly the inefficiency the diagnostic flags as the single largest addressable one in the system (POL.O1.F3: 95.6 % of the pledge-bonus budget already wasted today). Network-wide delegator yield collapses with it.
The bet that the SPO landscape will pledge up cannot be verified — and the mainnet evidence points the other way. CIP-0050 only stops being a pure clip if operators raise pledge to clear the L = 100 compliance line (1 % of pool stake). Today: 78 % of staked ADA sits in pools at pledge ratio below 1 % (POL.O2.F1); 42 of the 48 saturation-scale multi-pool operators forfeit the pledge bonus today (POL.O5.F3); pledge yield is 0.68 %/yr at best vs ~2.3 %/yr passive (POL.O2.F2). The dominance relation that produced today's non-pledging equilibrium is unchanged by CIP-0050 — the cap is a new gate before the reward formula, not a new gradient inside it. There is no mainnet signal predicting compliance at scale.
Most of the pool pot would return to reserve unused. Today, ~56 % of the 15.53 M ADA/epoch pool pot already returns to reserve unused (POL.O1.F1) — the participation gap (31.6 %) plus the unclaimed pledge-bonus budget (22.1 %, POL.O1.F3) plus minor causes. This is the single largest addressable inefficiency in the system. Applying L = 100 to today's pledge distribution stacks a new clip on top of that:
Segment
Share of productive stake
Effect on σ′ at L = 100
Compliant retail (π ≥ 1 %) + custodial-by-pledge
~12 %
Unchanged — full V1 reward
Custodial-by-extraction (CEX / IVaaS)
~9.5 %
σ′ → 0 — operators legally cannot self-pledge
Retail at low pledge (median π = 0.07 %)
~74 %
σ′ → ~7 % of σ — pool reward drops to ~7 % of V1 baseline
Custodial-by-delegation
~4 %
Mixed — roughly half-clipped on average
Stake-weighted, the eligible σ′ falls to ~19 % of original. Pool rewards distributed drop from ~6.79 M to ~1.29 M ADA/epoch — a 75 % drop in absolute distribution. Distribution efficiency: 44 % → ~8 %. Return-to-reserve: ~56 % → ~92 %. Annual extra ADA returning to reserve: ~400 M ADA/yr on top of today's already-large leak. The pathology POL.O1 names does not get fixed; it gets significantly worse.
Network-wide delegator yield collapses by ~5×. Today's net delegator ROS is ~2.27 %/yr on a compliant pool. Under CIP-0050 at L = 100 with today's pledge distribution:
Where the delegator sits
Today (V1)
Under CIP-0050
Effect
Compliant pool (~12 % of stake)
~2.27 %
~2.27 %
Unchanged
Custodial-by-extraction pool (~10 %)
~2.27 %
~0 %
Total cut
Median retail pool, π = 0.07 % (~74 %)
~2.27 %
~0.16 %
14× cut, 93 % drop
Stake-weighted network-wide ROS drops from ~2.27 % to ~0.44 % — an 80 % collapse in the headline yield delegators see across the network. Concrete: a 10 K ADA delegation at the median retail pool earns ~227 ADA/yr today and would earn ~16 ADA/yr under CIP-0050 — a 211 ADA/yr loss per 10 K stake. ADA staking becomes structurally uncompetitive against passive holding (no risk, no fees) and against any external benchmark.
Reading the three findings together.
CIP-0050 frames itself as a "soft cut-off". On today's mainnet — where the SPO landscape has already shown it cannot or will not pledge at compliance scale — it is anything but soft.
The dominance relation that produces today's non-pledging equilibrium is unchanged by the reform. So the cap acts as a binding clip on the majority of productive stake. Most of the pool pot returns to the reserve, and delegator yield collapses across the network. The closing-incentive-gap pathology the diagnostic names — the single largest addressable inefficiency in the system — gets dramatically worse, not better.
The fix is not at the cap. The fix is at the gradient: redesign A(ν, π) so pledge stops being a dominated strategy (stake-cap layer synthesis), and secure operator viability via the fee-layer first so the small-pool tail does not bleed out while the cap is biting. The "fee-layer first → stake-cap → k recalibration" sequencing the solution-evaluation conclusion names is the only order that does not move the productive landscape through a regressive intermediate state.
Appendix C — Origin and references
C.1. Identity card
Field
Value
CIP number
CIP-0050
Title
Pledge Leverage-Based Staking Rewards
Authors
Michael Liesenfelt, Ryan Wiley, Rich Manderino, Stef M, Wayne, Homer J, Chad
Authorship and moment. Written in April 2022 by Michael Liesenfelt and co-authors, updated in May 2025. The authors' central observation: under $a_0 = 0.3$, the yield gap between zero-pledge and fully-pledged pools is ~22 % — "statistically unnoticed" by delegators and dominated by epoch-to-epoch variance. The CIP converts pledge from a nudge (a small yield advantage that delegators could notice) into a constraint (a hard cap on reward-eligible stake that makes pledge decisive).
Scope. CIP-0050 modifies the reward-distribution formula itself (the σ' clipping rule), not the fee-layer split. It is therefore a pools-distribution-layer instrument, not a fee-layer instrument. A pool with clipped σ' produces less reward in total; the split between operator and delegators remains whatever the fee-layer parameters (minPoolCost, poolRate) dictate.
Relation to other CIPs in the evaluation bundle.
- Fee-layer CIPs (CIP-0023, CIP-0082) act on a different layer (post-per-pool-allocation split). CIP-0050 composes cleanly with either on the mechanical axis — they act on sequential stages of the reward pipeline — but the two sets target different V2 milestones.
- CIP-0037 is the other stake-cap candidate in this evaluation. Same target (§3.2 pledge signal + §3.4 concentration) via a different primitive (smooth saturation curve vs hard cap). A coherent V2 package picks one stake-cap instrument; stacking both is not canonical.
- k lever is the transversal parameter. CIP-0050 text argues $L$ converts a k-raise from a concentration risk into a decentralisation lever (stake-cap CIPs foreclose MPO fleet expansion; new slots therefore go to new operators rather than existing fleets). Standalone k-analysis: cip-0082 §B.3 standalone k-lever deep dive.
Transversal lever:cip-0082 §B.3 standalone k-lever deep dive — the standalone k-raise analysis; CIP-0050 is the stake-cap companion that converts a k-raise from a concentration risk into a decentralisation lever (CIP's own argument).
Multi-pool entities flourished (23 → 85 entities, 65% → 76% of productive stake) while single-pool operators struggle (555 → 291 pools, 39% → 24% of stake)
The designed entry → growth → established path is no longer observable. The productive set tracks a 700–1,000 band since epoch 300 (733 pools at epoch 623 as the threshold rises with total stake), with only 1.7% turnover per epoch — but composition has hardened underneath that flat aggregate. 83 attributed entities control 76.7% of productive stake (12 with 11+ pools alone hold 41.0%); multi-pool fleets grew from 23 to 85 while single-pool operators contracted from 39.1% to 24.4% of stake.
Three quarters of registered pools are economically irrelevant. 2,144 of 2,877 (75%) sit below the production threshold (~3M ADA) and together hold only 2.7% of stake · Three quarters of productive stake sits in 83 named entities. They control 76.7% through 449 productive pools (71 strict multi-pool + 12 attributed single-pool) — and the count is a lower bound (operators using fully separate per-pool infrastructure stay invisible)
9 findings
CEN.O2
When a Titan delegator switches pools, the whole pool moves with them — whale-funded pools swing ±20% between epochs (1 in 5 swings >50%) while retail pools barely move (±8%)
A pool's stake stability depends on who its delegators are — not on the market segment it competes in. In whale-funded pools (the 28 custodial-by-delegation pools, where the typical delegator holds ≥ 100K ₳), a single Titan-tier address (10M+ ₳) is large enough that when they move, the whole pool moves: stake swings ~±20% between epochs, and 1 in 5 of them swings more than 50%. The operator loses revenue predictability and the remaining delegators see their block-production rhythm wobble. Retail pools (broad small-delegator base) absorb churn smoothly — they only move ±8% between epochs. Custodial-by-extraction pools (≥ 99% margin) barely budge (±7%) because their delegators are locked in by inertia. What looks like delegator activity in the aggregate is mostly a handful of institutional treasuries shifting capital.
A single Titan delegator moving in or out can shake a whole pool — whale-funded pools swing ~±20% between epochs vs ±8% for retail. In the 28 custodial-by-delegation pools (typical delegator holds ≥ 100K ₳), stake moves by roughly ±20% between epochs, with 21% of them swinging by more than 50% — these are pools where a single address is large enough that its movement dominates the variance. Retail (809 pools, broad small-delegator base) is mostly stable (±8%) — no single delegator can move the pool. Custodial-by-extraction (79 pools, ≥99% margin) is the most inert (±7%) — stagnation, not active management
1 finding
CEN.O3
The delegator population is wildly skewed in stake — 1,000 of 1.36M delegators (0.07%) hold 57% of staked ADA, and 9× population growth has not shifted the shape
The delegator population is shaped like a power-law tail — almost all the staked capital sits in a tiny upper sub-population. Of the 1.36M active delegators, 1,000 (0.07%) hold 57% of staked ADA; the top 10,000 (0.74%) hold 79.2%; Gini = 0.976 — more concentrated than US wealth (~0.85) and comparable to the most unequal asset distributions in financial markets. The median delegator holds just 32 ADA while the mean is 16,055 ADA — a 500× gap that quantifies the skew. The population has grown 9× since epoch 300 without changing its shape: every cohort of new entrants has joined at the bottom of the distribution, leaving the top-1% share locked at 78–82%.
Half the delegator base stakes less than a single transaction fee at peak congestion. Median: 32 ADA. Mean: 16,055 ADA. The 500× gap measures the skewness of a power-law distribution where each tier above 10K ADA holds roughly 20% of total stake despite containing exponentially fewer delegators · The delegator population's stake is concentrated in its top 0.07%. 1,000 delegators (0.07% of the 1.36M population) hold 57% of staked ADA; the top 10,000 (0.74%) hold 79.2%. Gini = 0.976 — more concentrated than US wealth (~0.85) and comparable to the most unequal asset distributions observed in financial markets
3 findings
CEN.O4
Most delegators stay put for years — 42% have stuck with the same pool for 2.7+ years, only 21% switch within 25 days, and the population's switching rate is 75% below early Shelley
The delegator population settled long ago — most of it doesn't move. Tenure splits the population cleanly into three sub-groups: 42% have stayed with the same pool for 2.7+ years (201+ epochs), 21% switch within 25 days (≤ 5 epochs), 37% sit in the middle (somewhere between). Aggregate switching has collapsed 75% from 2,000–3,500 redelegations per epoch in early Shelley to 600–800 today — three regimes: experimentation → middle → mature. And almost all of that switching comes from the retail population: custodial and private pools barely move.
Pool-switching collapsed 75% from early Shelley. Redelegations fell from 2,000–3,500 per epoch (early Shelley experimentation) to 600–800 today — three regimes: experimentation (epochs 210–260) → middle period with hard-fork spikes (260–500) → mature settled market (500+) · The base splits cleanly into stickers and switchers, with a thin middle. 42% loyal (201+ epochs, > 2.7 years), 21% volatile (≤ 5 epochs, < 25 days), 37% moderate. The loyal majority anchors pool economics; the volatile tail generates the bulk of the churn signal
3 findings
CEN.O5
The bigger the delegation, the more it moves — whales (1M+ ₳) hold 65% of the staked supply and switch ~4× more often than small delegators
The bigger the delegation, the more often it moves. The smallest delegators (< 1K ₳) average just 0.67 pool switches over their lifetime — they delegate once and forget. Whales (1M+ ₳) average 3.06 switches — about 4–5× more. And whales hold 14.1B of the 21.8B staked supply (65%) — yet only 38% of that capital sits in long-term (201+ epoch) delegations. The bulk of the network's staked capital sits in the hands of its most actively-managed delegations. Pool operators depending on a few whale delegators therefore face structurally higher stake instability than those with a broad retail base.
Whales switch 4–5× more often than micro-delegators. Lifetime switches: <1K = 0.67, 1K–10K = 0.95, 10K–100K = 1.64, 100K–1M = 2.65, 1M+ = 3.06. Loyal share (201+ epochs): <1K = 82%, 1M+ = 39%. Switching intensity scales monotonically with stake size — small delegators delegate once and forget; large delegators actively manage their position · Most of the network's staked capital sits in delegations that move. Whales (1M+) hold 14.1B of the 21.8B staked total (65%), yet only 38% of that stake sits in loyal (201+ epoch) delegations — the rest distributes across moderate and volatile tenures. Pool operators dependent on a few large delegations face structurally higher stake instability than those with a broad base of small loyal delegators
2 findings
CEN.O6
The delegator population doesn't shop on price — half their switches produce zero yield change, switch direction is balanced (30.8% cheaper / 31.5% pricier), and 92% of long-term delegators sit in the cheapest 0–5% margin band
The delegator population behaves like passive parkers, not yield-shoppers. When delegators do switch, half (50.5%) land in pools with statistically indistinguishable yield (±5 bps; median ROS differential +0.02 bps — well below any threshold a delegator could observe). Switch direction is symmetric too: 30.8% go cheaper / 37.7% stay flat / 31.5% go pricier — no fee-chasing pattern. The one asymmetric move is by pool size (the population drifts toward larger pools regardless of price). And 92.1% of long-term delegators (201+ epochs) sit in the cheapest 0–5% margin band — the cheapest pools are also the stickiest, so loyalty and low fees coexist, they don't trade off. The DeFi sub-population is essentially absent: 99.83% of staked ADA is key-based; only 38M ADA across 399 script addresses is held by smart contracts.
Delegators cannot see what they're paying for — the yield signal is too flat to act on. Half of all switches (50.5%) produce zero yield change (±5 bps); the median ROS differential is +0.02 bps with an interquartile range of −0.47 to +0.55 bps. The signal is an order of magnitude below any threshold a delegator could observe, let alone optimise against · Operator take direction is balanced — no fee-chasing pattern is detectable. 30.8% of switches go to a cheaper pool, 31.5% to a more expensive one, 37.7% land at the same take. The take × ROS matrix's diagonal dominates (lower take → better ROS at 18.4%, similar → similar at 25.6%, higher → worse at 16.5%) — confirming take and ROS are two views of one signal, and that signal is too flat to drive behaviour
5 findings
CEN.O7
The non-participant population is 39.8 % of the supply, structurally inert, and held by a tightly-concentrated minority of custodians and legacy holders
The non-participant population — addresses controlling ADA that is not delegated to any pool — has been stable at 36–39 % of circulation for over 300 epochs (14.4 B ADA at epoch 623). Only 0.37 % of circulation is reachable by reward design (registered staking key but not delegated); the remaining 39.4 % sits in addresses that cannot delegate without a protocol-level change. The "unreachable" core is not a faceless retail tail — 246 wallets hold 74 % of it, top-3 alone hold 19 %; the addresses split cleanly into recognisable archetypes (exchange hot wallets, institutional cold storage, pre-staking-era legacy holders, DeFi vaults). The "addressable" pool collapses to ~2,100 active accounts and 0.06 % of supply once zero-balance shells and a single DeFi vault are removed. The reward mechanism's recruitment ceiling is narrow; meaningful re-engagement requires changing the address architecture, not the incentive curve.
The staking rate is structurally declining despite persistent net delegator inflows. The rate has fallen from 71% (epoch ~260) to 59% (epoch 623) — a 12 pp loss over ~360 epochs. Circulating ADA grew from ~32B to ~37B while staked ADA grew from ~23B to only ~22B; the non-participant pool is growing faster than the staking pool. · 14.36B ADA (39.8% of circulating supply) does not participate in staking — and only a sliver of that is reachable by reward design. The non-participant pool has been stable at 36–39% for over 300 epochs. Only 0.37% of circulation (134.6M ADA, 24,176 accounts) is nominally addressable by an incentive-design change — and even that figure shrinks under scrutiny (§5.5). The remaining 39.4% sits in addresses that cannot delegate without a protocol-level change.
8 findings
CEN.O8
The active submitter population is shrinking and concentrating into a smaller, more active core
The submitter population — addresses paying fees in any given epoch — collapsed from a peak of 790,335 actors (epoch 304) to 31,176 (epoch 627), a −96% contraction against only a 92% drop in transactions. The same population now transacts ~3.8× per epoch (vs ~2.0× at peak), and the address-to-transaction ratio fell from 0.88 (epoch 210) to 0.26 (epoch 627). The chain is not losing activity; the population doing it is shrinking while each surviving member transacts more often.
The submitter population peaked at 790K addresses and has since contracted by 96% — the chain runs busily, with a much smaller crowd. The population grew in step with transaction count through early Shelley, peaking at 790,335 unique addresses and 1,566,974 transactions at epoch 304 (the CNFT minting frenzy). From epoch 310 onward the population collapsed faster than volume: 101K submitters at epoch 384, 58K at epoch 500, 31,176 at epoch 627. Transaction volume fell only 92% over the same window — a population one twenty-fifth of its peak still sustains three quarters of the per-epoch transaction rate seen during 2023–2024. · Breadth is collapsing while per-actor intensity is rising — the same shrinking core just transacts more often. The address-to-transaction ratio fell from 0.88 (epoch 210) to 0.26 (epoch 627), and tx-per-submitter rose from ~2.0 (epoch 304) to ~3.8 (epoch 627). Cumulative Shelley-era throughput totals 118.07M transactions and 37.85M ADA in fees. The growth-trajectory signal is unambiguous: new addresses are not entering the fee-paying population at a rate that would sustain breadth — the same shrinking core is just transacting more often.
2 findings
CEN.O9
Two submitter sub-populations coexist: a stakeable head-count majority and a small non-stakeable minority that pays a third of the fees
At epoch 627, the stakeable majority — base-key (addr1q) addresses carrying a stake credential — is 73.3% of submitter head-count and pays 47.4% of fees. The non-stakeable minority — enterprise (addr1v, addr1w) and legacy Byron addresses that structurally cannot delegate — is only ~16% of head-count but generates 30.1% of fee revenue (averaged 622–627), and that share has not fallen below 14% since the Alonzo era. The reward pipeline taxes a sub-population it cannot reward.
By address count, the submitter population remains overwhelmingly stakeable — but the script segment has grown structurally. At epoch 627: 73.3% base-key (addr1q) addresses carrying a stake credential, 10.8% base-script (addr1z), 9.2% enterprise-key (addr1v), 4.9% legacy Byron, 1.6% enterprise-script (addr1w), 0.2% base-other. Compared to the earlier snapshot at epoch 384 (87% base-key, <1% script), the shift is clear — base-key dropped 14 pp while base-script grew from 0.4% to 10.8%. The count-based picture remains misleading: the small script population punches far above its weight in fee terms. · Roughly 30% of fee revenue is generated by addresses that structurally cannot delegate, and this share has been stable since Alonzo. Over the recent 6-epoch window (622–627): enterprise-script (addr1w) 17.0%, enterprise-key (addr1v) 10.8%, legacy Byron 2.3% — totalling 30.1%. The non-stakeable fee share has oscillated between 18% and 44% since epoch 300, averaging ~25%; the structural floor is set by DeFi contract activity, the ceiling by speculative episodes. At no point since Alonzo has it fallen below 14% — the reward mechanism taxes a constituency it excludes.
2 findings
CEN.O10
A small DeFi-script sub-population — ~3,800 contracts at epoch 627 — generates a third of the fee base
The script-using sub-population — base-script (addr1z) and enterprise-script (addr1w) addresses — is 3,851 actors at epoch 627 (12.4% of submitters) and generates 36.0% of epoch fees. Across the full post-Alonzo era it represents 12.5% of transaction count but 29.6% of cumulative fees. The per-address fee rate of an enterprise-script submitter (12.1 ADA/epoch) is 14× that of a base-key submitter (0.83 ADA/epoch). The chain's fee floor is supported by a population of roughly 3,800 smart contracts — a population dimension the current incentive design does not address.
Script transactions are 12.5% of post-Alonzo count but 29.6% of cumulative fees — the DeFi economy pays a 2.4× per-transaction premium. The premium peaked above 3× during the Alonzo era (epochs 310–340), when fewer than 30% of transactions commanded over 60% of fees. It has moderated to ~1.5× in recent epochs but remains structurally above parity. For the sustainability argument, this means per-transaction fee intensity is coupled to script adoption — a variable the current incentive design does not address. · At epoch 627, ~3,800 script addresses (12% of submitters) generate 36% of fee revenue — the pipeline depends on the continued operation of these contracts. Specifically: 490 enterprise-script + 3,361 base-script = 3,851 actors (12.4% of the submitter population) generated 14,481 ADA in fees — 36.0% of the epoch total. The per-address rate of an enterprise-script submitter (12.1 ADA/epoch) is 14× that of a base-key submitter (0.83 ADA/epoch). The script population grew sixteen-fold since epoch 384 (0.7% → 12.4%) while their fee share held steady around one third — the per-address premium has moderated but the structural dependency has deepened.
2 findings
CEN.O11
The fee-paying population is bimodal: a heavy-paying core of a few hundred high-frequency actors and a long tail of ~147K small contributors
Over epochs 622–627, the top 10 addresses generate 20.0% of fees and the top 500 generate 58.4% — out of ~147K active submitters. The heavy-paying core is recognisable: a MinSwap DEX-script address leads, followed by addresses tied to the NUFI, TITAN, BERRY, and OYSTR pools and several enterprise-script DEX contracts and bot wallets. The concentration is heavy-tailed but below the delegation Gini of 0.976. 500 addresses out of 147K (0.34%) pay the majority of fees — the fee floor depends on a sub-population small enough to know by name.
The top 10 addresses pay 20% of all fees; the top 500 (out of ~147K) pay 58%. Over epochs 622–627, 500 addresses out of ~147K (0.34%) pay the majority of fees. Concentration is heavy-tailed but less extreme than delegation stake (Gini 0.976). Compared to the prior 618–623 window (top-10 = 24.3%, top-500 = 60.8%), the recent window shows a mild de-concentration of 4 pp at the top — driven by a single very-high-volume address whose activity tapered. The fee base sits on a few hundred high-frequency automated actors, not a diffuse retail tail. · The top 10 fee payers ran 110,739 transactions over 6 epochs (16.1% of volume) — fee-pot stability hinges on a population small enough to know by name. The top 50 ran 219,720 transactions (32.0%) over the same 6-epoch window. The top fee payers are dominated by recognisable archetypes: a MinSwap DEX-script address leads at 12,105 ADA over 6 epochs; pools tied to NUFI (NuFi exchange-style operator), TITAN, BERRY, and OYSTR appear among the top 10 alongside enterprise-script DEX contracts and bot wallets. The fee floor of the network depends on a population of ~10 actors whose churn risk is not modelled by any incentive parameter.
2 findings
CEN.O12
The fee-paying population and the delegator population barely overlap — funders and beneficiaries are largely different people
Joining the submitter set (~147K addresses, epochs 622–627) to the 1,352,113 active delegators at epoch 627 reveals the population gap: only 41.8% of fee revenue comes from currently-delegating addresses; 28.1% from base addresses whose stake credential is not in the delegation set; 30.1% from addresses with no stake credential. From the delegator side, only 3.1% of the 1.352M delegators submit any transaction in a 6-epoch window. Fewer than 4 ADA in every 10 ADA of fees flow back to the population that paid them through any reward channel.
Only 41.8% of fee revenue comes from currently-delegating addresses; the remaining 58.2% comes from addresses outside the delegation set at the snapshot epoch. Across epochs 622–627, the 1.352M delegators at epoch 627 contributed 41.8% of fee revenue (92,538 ADA out of 221,565). The stakeable-but-inactive segment (base addresses whose stake credentials are not in the delegation set) contributed 28.1% (62,340 ADA). The structurally non-stakeable segment (enterprise + legacy) contributed 30.1% (66,684 ADA). The mismatch is symmetric on both sides — the funding base does not match the reward base. · Only 3.1% of delegators submit any transaction in a 6-epoch window — 96.9% of delegators are passive holders. Of the 1,352,113 active delegators at epoch 627, only 42,082 appear as the first input of any transaction during epochs 622–627 (a 30-day window). The remaining 1,310,031 (96.9%) hold stake, accrue rewards, and never touch the chain. From the other side, the submitter base has 76,561 unique stake credentials over the same window, of which 42,082 (55.0%) are in the delegation set — the rest carry a stake credential that has never been delegated, has been deregistered, or sits idle.
3 findings
TRE.O1
The epoch pot rests on a single source — and that source has crossed its half-life
The protocol's reward formula admits three inputs to the epoch pot — monetary expansion, transaction fees, deposits. In practice only one matters.Monetary expansion supplies ~99.8% of the pot; fees contribute ~0.17% and even at full realistic network capacity would cover only 1.3% of the expansion term (a ~100× structural gap in fee revenue terms); the deposit channel is unmeasurable at epoch granularity. Stake pool operators assemble the pot reliably (η = 0.977 average — the cooperative-behaviour gate is satisfied but never binding). The budget therefore depends almost entirely on the reserve, which is shrinking by 0.3% every epoch.
Monetary expansion is the only material input to the pot — supplies ~99.8%, every epoch, since Shelley. Outside a single recent anomaly at epoch 620 (~5% fee share), fees have never crossed 3% — even during peak NFT/DeFi activity. The pot's trajectory is therefore tied almost entirely to reserve stock and ρ; the formula admits three sources but the mechanism behaves as if it had one · Fee revenue is structurally insufficient — closing the gap requires fee revenue to grow ~100× (two orders of magnitude). Fees contribute ~0.17% of the pot at epoch 623, and even the realistic capacity ceiling (~254K ADA/epoch at 3.1 TPS × 432K s × 0.19 ADA/tx) covers only ~1.3% of the reserve expansion term (~19.23M ADA). Closing the gap requires a throughput upgrade (Leios), a structural shift in transaction demand, and higher per-tx pricing (no single lever suffices); until that crossover, the second source named in the SL-D1 formula is a rounding error
4 findings
TRE.O2
The reserve has crossed its half-life — the budget is on an exponential decay schedule
The reserve has fallen from 13.29B to 6.45B ADA — −51.43% in ~5.7 years of Shelley operation. The decay is exponential: every epoch draws 0.3% of whatever remains, so the nominal pot has already halved (from ~39.9M to ~19.36M ADA/epoch) and continues to shrink mechanically even when participation does not. Significant reward pressure is projected at epochs 1000–1200 (~2028–2029) when expansion-driven rewards stop matching today's scale.
The reserve is half-depleted in 5.7 years and the nominal expansion has already halved. Stock has fallen from 13.29B → 6.45B ADA (a −51.43% decline) over ~5.7 years; the nominal monetary draw has dropped from ~39.9M → ~19.36M ADA/epoch. Because the formula draws a fixed 0.3% of remaining reserve, the decay is exponential — the absolute pot keeps shrinking even when participation does not. The single-source budget identified in TRE.O1 is now visibly thinning, on a schedule the formula cannot reverse · Significant reward pressure begins at epochs 1000–1200 (~2028–2029). At current parameters and participation, the reserve reaches ~2B ADA in this window — at which point per-epoch rewards drop materially. Full depletion is projected around epoch 3500 (~2040s). The window for governance to intervene before the pot becomes too small to incentivise meaningful staking is on the order of 3–4 years
2 findings
TRE.O3
Less than half of the pools pot reaches operators and delegators — the rest props up the reserve as a side effect of low participation
Of the 15.39M ADA/epoch allocated to the pools pot, only 6.78M ADA (~44%) actually reaches operators and delegators; the remaining ~8.61M returns to the reserve. Cumulatively over 413 epochs, 4.61B ADA has flowed back this way — ~71% of the current reserve stock exists because rewards were not fully distributed. The primary driver is upstream of the formula: ~16.8B ADA (~43.6% of circulating supply) does not participate in delegation at all. The reserve has lasted as long as it has because the system has been failing to pay out — adoption that pulls inactive stake into the game would accelerate depletion.
Less than half of the pools pot reaches its intended recipients. Of the 15.39M ADA allocated to the pool side at epoch 623, only 6.78M ADA (~44%) is distributed to operators and delegators; the remaining ~8.61M returns to the reserve. The mechanism therefore operates at less than half of its design throughput in steady state — the SL-D1 distribution rules are intact, but the pool-by-pool conditions for full payout are not met across most of the landscape · Cumulative undistributed rewards account for roughly three quarters of the current reserve stock. Over 413 epochs the return-to-reserve channel has accumulated 4.61B ADA — about 71% of the 6.45B ADA the reserve holds today. This buffer is a side-effect of incomplete distribution, not a design feature: the reserve has lasted as long as it has largely because the system has been failing to pay out. Any reform that improves distribution efficiency therefore accelerates depletion
3 findings
TRE.O4
The two parameters that govern this whole layer have never been adjusted
The treasury rate (τ = 20%) and the monetary expansion rate (ρ = 0.3%) have remained at their day-one values for the full ~5.7 years of mainnet operation. Neither has been the subject of a formal governance proposal. The current pot, treasury inflow, and reserve trajectory all reflect parameter choices made for a network with very different supply, participation, and pool-count conditions — and the absence of any review path is itself a structural feature.
Treasury rate (τ = 20%) and monetary expansion rate (ρ = 0.3%) have never been adjusted since Shelley. Both parameters were set on 2020/07/29 and have remained at their day-one values across ~5.7 years of mainnet operation. Decentralisation d was gradually reduced to 0 (epochs 208–257) and k was raised from 150 to 500 (Aug 2020) — but the reward-level parameters that drive every quantity in this section remain frozen, and neither has been the subject of a formal governance proposal
1 finding
POL.O1
Participation gap and unused pledge-incentive budget return 54% of the pool pot to reserve
Only 6.79M of 15.53M ADA/epoch reaches operators and delegators — a 44% distribution efficiency.
Two causes dominate the loss: the participation gap (unstaked ADA) returns 4.91M ADA/epoch — 31.6% of the pot, upstream — outside formula control; the unused pledge-incentive budget returns 3.43M ADA/epoch — 22.1% of the pot, 95.6% of the bonus allocation wasted.
All other causes are an order of magnitude smaller — pledge-not-met confiscation (2.1%), performance (0.5%), oversaturation (0.3%).
Less than half the pool pot reaches its targets. Only 6.79M of the 15.53M ADA per epoch budgeted for distribution actually reaches operators and delegators — a 44% distribution efficiency. The other 56% returns to the reserve unused · ADA that isn't staked at all is the single largest source of waste. Every epoch, 4.91M ADA is forfeited because roughly a third of the supply sits unstaked — that's 31.6% of the pot, returned to the reserve before the formula even gets a chance to distribute it
4 findings
POL.O2
Pledge is unused at scale and structurally unfair across pool sizes
78% of staked ADA sits in pools with pledge ratio < 1%; the stake-weighted median is 0.07%. The bonus that should reward commitment is silent for almost every operator.
The unfairness is algebraic, not just empirical. The activation function A(ν, π) = ν² · π[1 - π(1 - ν)] has three structural defects: a permanent quadratic size penalty ν² that scales every pledge ratio against pool size; a non-monotone regime in π for any pool below half-saturation, where pledging more than π^ = 1/[2(1-ν)] pays less; and a cubic collapse to ν³ at full self-pledge, where the strongest possible commitment is paid the worst-case scaling on size.
The combined consequence: yield on pledge capital tops out at 0.68%/yr at saturation (vs. 2.3%/yr passive delegation), and 3.4M ADA/epoch* (22% of pot) reserved for the bonus returns to reserve unclaimed.
Almost no operator pledges meaningfully.78% of staked ADA sits in pools where the operator pledges less than 1% of the stake they manage; the stake-weighted median pledge ratio is 0.07% · Pledging earns less than passive delegation, even at maximum scale. A fully-saturated pool whose operator pledges the entire saturation amount earns just 0.68%/yr on that pledged capital — below the 2.3%/yr anyone can earn by passively delegating
6 findings
POL.O3
Three structural thresholds shape pool space: production (physics), viability (economics), saturation (formula)
Three thresholds emerge from the protocol's own mechanics and partition the pool population. Each has a different nature and a different mutability profile.
Production threshold (~3M ADA) — physics, emergent. The stake at which a pool produces ≥1 block per epoch with 95% probability (λ=3 in the Poisson process — blocks are produced reliably enough for yield to be a usable signal for delegators). Not a protocol parameter; rises with active stake (to ~5.35M at full supply). The 1-block-expectation point (~1M ADA) is a special case at the bottom edge of this regime — below it, pools produce less than one block in expectation per epoch.
Viability threshold — economic, and it moves; sits structurally above the production threshold. The protocol's minPoolCost floor (currently 170 ADA, halved from 340 at epoch 445 / 2023-10-27; most pools still set 340) gives a nominal break-even at ~1.1M ADA — but this is just the formula's internal floor. Real economic viability requires covering infrastructure (~1,320–3,240/yr for block-producer + 2 relays + monitoring) plus operator labour at market DevOps/SRE rates (~5,160/yr minimum at 10 hrs/mo × 43/hr) — totalling ~7,160/yr minimum, easily doubling for a more demanding setup. Because operator costs are fiat-denominated while revenue is in ADA, the real target tracks the ADA/USD price (~28,600 ADA/yr at 0.25; ~71,600 at0.10). At today's prices no single-pool tier comfortably clears it; competitive compensation begins only at the 2-pool MPO tier.
Saturation cap (77M ADA = z₀ = 1/k) — formula, fixed by parameter. The reward ceiling per pool, designed to limit any single pool's share of network reward.
The cleaner future state would collapse viability into production, leaving only the physics-grounded boundary. This is harder than it sounds — zeroing minPoolCost removes the protocol-imposed floor, but the real labour-cost floor remains unless a structural mechanism (e.g., Rocket-Pool-style shared operations) is introduced. See §1.2.4.4.1 Enforce the production threshold.
The boundaries are dynamic — they shift with active stake, fixed costs, k, and the ADA/USD price — so any CIP must be evaluated against where they move, not against a snapshot.
The production threshold is physics-based — emergent from slot-leadership, not a parameter. At today's active stake (~21.18B ADA), regular block production starts at ~3M ADA, the stake level at which a pool has a 95% probability of producing at least one block per epoch (λ=3 in the Poisson process) — the point where yield is usable as a delegator signal. The 1-block-expectation point (~0.97M ADA) is a special case at the bottom of the regime: below it, pools have less than one expected block per epoch and rewards are noise, not signal. The threshold rises with active stake — at full supply (~38.5B ADA), the 3-block point climbs to ~5.35M ADA, pushing more pools below it · Operator-viability is volatile and tracks the ADA/USD price; at today's prices it coincides with the production threshold, but separates upward when ADA falls. A single-pool operator needs to extract roughly 390 ADA/epoch today (~7,160/yr cost floor — infrastructure ~1,320–3,240/yr + DevOps labour ~5,160/yr min — at0.25 ADA). At the production threshold (~3M ADA stake), the pool generates ~2,145 ADA/epoch on average, more than enough — viability and production coincide. At lower ADA prices the cost in ADA rises, and the reliable-income floor rises above production. The threshold is therefore not drawn as a fixed line in the rest of this document; it is treated as a separate volatile concept whose stability is a question for the V2 spec, not the diagnostic
5 findings
POL.O4
A 73% sub-block tail (useless to consensus) and a 27% productive segment (unreadable without entity-level investigation)
The pool population splits cleanly at the production threshold, and the two segments answer different questions.
Below the production threshold (~3M ADA): a sub-block tail invisible to consensus.1,987 pools (73% of all pools with stake) sit below the 95%-block-probability bar and produce blocks too sporadically to be useful for the consensus protocol — they hold only 2.7% of active stake and exist as ghost capacity the protocol admits but cannot reliably activate. Below this threshold, a delegator cannot read a meaningful yield signal from any single pool — Poisson noise dominates the mean.
Above the production threshold: the productive segment cannot be read pool-by-pool.731 pools (27%) hold 96.6% of staked ADA and carry the network's actual block production. But each pool appears on-chain as if it were independent, while in fact multi-pool entities run fleets — pool count is therefore a poor proxy for operator count, and pool-level metrics conceal entity-level concentration. The entity-level breakdown — counts, archetypes, who responds to the pledge signal — is the subject of POL.O5 — entity-level analysis.
1,987 pools (73%) sit below the production threshold (~3M ADA) and produce blocks too sporadically to carry consensus reliably. At the production threshold a pool has a 95% probability of producing ≥1 block per epoch (λ=3); below it Poisson noise dominates and yield is statistical noise. Collectively these pools hold only 2.7% of active stake — ghost capacity the protocol admits but cannot reliably activate; neither delegators nor the consensus layer can read a meaningful signal from any single pool in this segment · The productive segment (731 pools, 27%) holds 96.6% of staked ADA — the actual consensus-carrying population. This is the segment any reform of k, the pledge curve, or the saturation cap actually moves. Pool count is not stake share: the inversion of headline pool count vs. stake share is the defining structural feature of the landscape
3 findings
POL.O5
83 multi-pool operators control 76.7% of productive stake — and almost none of them pledge
83 attributed entities operate 449 productive pools holding 16.24B ADA — 76.7% of productive stake.
The pledge picture is stark: of the 48 entities with enough capital to ever fill a pool to saturation, 42 sit at zero-pledge (pledge ratio < 2%), holding 12.20B ADA combined.
Architecture explains part of it: 10 of those 42 (CEX + IVaaS — Coinbase, Binance, Figment, Kiln…) hold 7.39B ADA they legally cannot pledge — exchanges custody retail balances, institutional validators run client assets. But that is only half the story. The other 32 are sovereign saturation-scale MPOs holding 4.80B ADA (22.7% of productive stake) that could pledge meaningfully but choose not to — they forfeit ~556K ADA/epoch in pledge bonus and absorb the cost. The architectural barrier is real; the strategic abandonment is larger as a share of the entities that could play. Only 2 of the 48 MPOs actually pledge most of their stake (≥80% pledge ratio) — Cardano Foundation (which pledges out of institutional duty, not in response to the formula) and Adalite Platform. Among private operators making an economic decision, the pledge mechanism currently succeeds on exactly one entity (Adalite).
Three quarters of the network's productive stake sits in 83 named entities. They operate 449 productive pools (≥3M ADA at epoch 623, the production threshold) holding 16.24B ADA — 76.7% of productive stake. 71 are strict multi-pool fleets; 12 are single-pool operators attributed by ticker, metadata, or relay clustering. The remaining 23.3% (4.94B ADA across 284 pools) sits in unattributed single-pool operators — attribution is a lower bound · 48 MPO entities concentrate 14.55B ADA — 68.7% of productive stake — in operators each big enough to fill a saturation cap. These are the saturation-scale MPOs (aggregate stake ≥ z₀ ≈ 77\textM ADA). Concentration at the entity tier is sharper than the 76.7% headline once the 35 sub-saturation entities (1.69B ADA, multi-pool by form but single-pool-like in economics) are stripped out. The top 5 of the 48 alone hold 5.44B ADA — 25.7% of productive stake (Coinbase, CHUCK BUX, Figment, Binance, Kiln); the top 10 hold 39.1%. The split is purely structural — pledge is taken up next
7 findings
POL.O6
Only 284 productive single-pool operators remain — and almost none of them pledge (like MPOs)
The "741 healthy pools" headline was 3× inflated. Strip out the fleet pools that were actually being run by multi-pool entities, and only 284 productive single-pool operators remain (productive = pool stake ≥3M ADA at epoch 623, the production threshold).
Almost none of them pledge.80.6% of single-pool productive stake sits at zero-pledge (< 2% pledge ratio). This is not irrational — at single-pool scale, the pledge bonus pays less than passive delegation, so locking ADA into the pledge is dominated. They are responding correctly to weak incentives, not failing to play.
Only 51 operators sit in the middle (pledge ratio between 2% and 30%) — the narrow group a parameter reform could plausibly move. Everyone else is either above the bar already (very rare) or below it (zero-pledge).
And the segment is shrinking. Its share of active stake fell from 28.0% → 25.0% since epoch 583 — capital is flowing toward MPO fleets, not toward the single-pool operators the mechanism was designed for.
The competitive field of single-pool operators is 3× smaller than the Incentive Mechanism Analysis headline. Lopez de Lara reported 741 'healthy' pools as evidence of a functioning incentive landscape; once MPO fleet members are stripped out, only 284 single-pool operators remain. 61% of the headline were fleet pools — operating under entity-level strategies (delegation source, fee setting, pledge), not the single-pool economics the headline was supposed to be about · At single-pool scale, pledging is rationally priced as not worth it.80.6% of single-pool productive stake (227 of 284 pools) sits in pools whose self-pledge is less than 2% of the stake they manage — call this zero-pledge: the operator has effectively declined the pledge bonus. The economics explain why: at single-pool scale, locking own ADA into the pledge yields at best 0.68%/year while passive delegation pays ~2.3%/year, so the pledge is dominated by the alternative use of capital at every realistic ratio. These operators are not failing to pledge — they are correctly responding to a formula that prices their effort below the delegation alternative.
4 findings
POL.O7
The pledge mechanism reaches only 36% of stake — and the 64% outside it splits into three populations no single parameter can pull back in
The pledge bonus was designed to discipline operator behaviour across the network. In practice it reaches only 36% of active stake (7.89B ADA) — single-pool operators plus the few MPOs that pledge meaningfully.
The other 64% is unreachable for three different reasons, each requiring a different fix: (i) Architectural — 10 entities, 7.39B ADA. CEX + IVaaS legally cannot pledge — exchanges custody retail balances, institutional validators run client assets they don't own. (ii) Strategic — 32 sovereign saturation-scale MPOs, 4.80B ADA. Community fleets, independent MPOs, multi-brand fleets, ecosystem stewards. They could pledge — they choose not to because the bonus pays less than passive delegation at their scale. (iii) Sub-scale — 35 sub-saturation MPOs, 1.69B ADA. Aggregate stake below one saturation cap; the pledge bonus is mechanically too small at their size to register.
77 of 83 attributed entities sit in one of these three buckets. Conflating them into a single "raise a₀" debate is why parameter reform alone keeps producing the same equilibrium.
The pledge mechanism's actual reach is 36% of active stake — 7.89B ADA. Strip out the entities that don't respond to the pledge signal, and what remains (single-pool operators + the few MPOs that do pledge meaningfully) carries 7.89B ADA out of ~21.7B active. The other 13.89B ADA — 65.6% of productive stake — is held by entities the bonus does not reach. The mechanism was designed to discipline operator behaviour across the whole network; in practice it operates on roughly a third of it. · MPO non-response splits into three distinct populations — confusing them is what keeps reform from working.Architectural: 10 entities (CEX + IVaaS) holding 7.39B ADA that cannot pledge by law/business model — exchanges custody retail balances, institutional validators run client assets they don't own. Strategic: 32 sovereign saturation-scale MPOs holding 4.80B ADA that could pledge but choose not to — at their scale the bonus pays less than passive delegation. Sub-scale: 35 sub-saturation MPOs holding 1.69B ADA whose entire fleet cannot fill one saturated pool — pledging is mechanically too small to matter. These are three different problems wearing the same label
3 findings
OPE.O1
The flat fee (fixed cost) dominates operator revenue — but governance sets it, and operators resisted the last cut
The flat fee delivers 60% of retail operator revenue — yet operators don't compete on it. 89.5% of pools pick one of two floor values (the ones governance allows), so the parameter is effectively a governance-set price, not a competitive lever. When governance halved the floor from 340 ₳ to 170 ₳ in 2023, only ~36% of operators moved to the new floor — 64% still declare 340 ₳ today, 178 epochs (~1.5 years) after the cut. Operators are slow to follow even governance, and they actively resisted lowering the price the cut was meant to deliver to delegators.
The passive channel dominates the active one — the flat fee delivers 60% of operator revenue, the commission only 40%. Across the retail market, the fixed ₳/epoch flat fee accounts for 60% of operator revenue; the proportional commission accounts for the remaining 40%. The channel that dominates revenue is the one operators almost never touch. · Governance halved the floor 178 epochs ago — 64% of pools have not moved. The minPoolCost floor was halved from 340 ₳ to 170 ₳ through a successful governance action. 178 epochs later (~1.5 years), 64% of pools still declare 340 ₳ — including most of the largest entities. The price most operators charge is not a pricing decision; it is a governance setting they never revised.
5 findings
OPE.O2
The commission (margin) is doing two unrelated jobs: pricing a service on one side, privatising a pool without pledging on the other
The commission was designed as the operator's pricing tool: set a rate, charge it on each reward. On mainnet that role has split in two. 87% of pools use it as intended — commission ≤ 10%, pricing the service. 12% of pools set it ≥ 99%, taking essentially all rewards regardless of who delegates: a private pool funded by delegation, functionally equivalent to a self-pledged pool but without locking any capital. The 89-percentage-point range between the two uses is essentially empty (only 12 pools). The protocol exposes a continuous parameter; operators reduce it to two unrelated economic stances — price a service, or quietly privatise the pool.
The commission distribution is bimodal with an 89pp empty middle.87% of pools set a commission at or below 10%; 12% set ≥ 99% (privatisation). The 89-percentage-point range between 10% and 99% contains only 12 pools. No economic attractor exists between competitive pricing and total extraction — operators either compete or fully privatise their pool, and almost no one in between · The market self-organises into four discrete tiers, not a continuous price distribution. No-commission (170 pools, 17.9% — almost certainly self-pledged), competitive (658 pools, 69.1% — at or below 10%), no man's land (12 pools, 1.3% — between 10% and 99%), privatisation (112 pools, 11.8% — at or above 99%). The four bands are an emergent equilibrium, not a design choice — the formula offers a continuous parameter and operators reduce it to four economic stances.
2 findings
OPE.O3
21% of productive stake is custodial — three mechanisms, three economics
21.1% of productive stake sits in pools where the operator effectively keeps the rewards rather than delivering them to a retail delegation market. The delegation flow exists on-chain, but it isn't doing the work the formula assumes — the operator is. Three on-chain-detectable mechanisms achieve this, with very different per-entity economics:
(i) By pledge — self-funded pools. 10 entities self-stake their own pools (operator owns ≥95% of the delegation). They capture 100% of rewards because they are the delegators. Median: 1.76M ₳/yr per entity.
(ii) By extraction — near-100% commission. 57 entities set the commission ≥ 99%, taking essentially all rewards regardless of who delegates. The pool is funded by delegation, but the operator collects everything (see OPE.O2). Median: 282K ₳/yr.
(iii) By delegation — whale-only pools. 15 entities operate pools where the typical (median) delegation exceeds 100K ADA — meaning the "delegators" are a small circle of whales, not retail. The pool serves an inner circle, not the open market. Median: 29K ₳/yr.
The three mechanisms produce three very different revenue scales (60× spread), but share the same underlying property: the open delegation market is not allocating this stake — the operator is.
A fifth of productive stake is custodial — and it splits into three distinct mechanisms, not one.79 entities operating 143 pools hold 4.55B ADA — 21.1% of productive stake in custodial pools. The split: (i) by pledge (10 entities, 36 pools, 1.59B — operator self-funds the pool); (ii) by extraction (57 entities, 79 pools, 2.04B — high commission on inert delegators); (iii) by delegation (15 entities, 28 pools, 0.92B — typical delegation ≥100K ₳). Each mechanism is detectable from on-chain observables and produces a different operator economics · The median delegation is what separates retail from custodial — not the mean. Custodial-by-delegation flags pools where the per-pool median delegation (db-sync epoch_stake) is ≥ 100K ₳ — i.e., where the typical delegator is a whale, not the average dragged up by one whale. For comparison, a delegation of 50K ₳ is already in the top 1.5% of all delegations on the network. The median measures the delegator's experience; the mean measures capital concentration. They are not the same signal.
3 findings
OPE.O4
The retail market is 79% of stake and the typical delegator holds 87 ₳
Once custodial pools are filtered out, the retail market is 809 pools, 516 entities, 17.02B ADA and 1,272,836 delegators — with a median delegation of 87 ₳ that is remarkably uniform across operator types, from independent single-pool to Coinbase and Binance.
Once custodial pools are filtered out, the retail market is bigger than mean-based estimates suggested — and it includes institutions.809 retail pools, 516 entities, 17.02B ADA, 1,272,836 delegators. The retail-by-median-delegation classification keeps Coinbase, Binance, Kiln and other institutional operators inside the retail market — because their typical delegator is a small holder, even if the institutional brand is large. The retail market is the population the mechanism was designed for; it is the population every reform has to address · The typical retail delegator holds 87 ₳ — and the median is remarkably uniform across operator types. The median retail delegation across the entire 1.27M-delegator population is 87 ₳. Per-operator-type medians range from 45 to 962 ₳ — a tight 20× span across pool types from independent single-pool to Coinbase. Retail delegators are small, homogeneous, and yield-insensitive at this scale — any reform that prices below 87 ₳/year of incremental yield will not change their behaviour
2 findings
OPE.O5
Delegators pay 18× more for the same return
A sub-reliable delegator pays 48.3% effective price for 2.04% net return; a near-saturation delegator pays 2.7% for 2.34% — 18× the price for 0.30 percentage points of extra yield. Net return converges to 1.95–2.34% across the entire retail market — a signal too narrow to discipline pricing.
A delegator pays 18× more for 0.30 percentage points of extra yield. A delegator in a sub-reliable pool pays a 48.3% effective price (flat fee + commission as % of pool reward) for a 2.04% net return. A delegator in a near-saturation pool pays 2.7% for 2.34% — 18× lower price for 0.30pp more return. The effective price is a mechanical artefact of pool size (the flat fee's 1/σ regression), not a market signal — operators are not pricing competitively, the formula is pricing them · Net return converges to a narrow 1.95–2.34% band across the entire retail market — the signal is too weak to drive delegation. Regardless of pool size, operator type, or pricing plan, a retail delegator's net yield ends up between 1.95% and 2.34% — a 0.39 percentage point spread across the whole market. At this resolution, the yield signal cannot discipline operator pricing — delegators are not chasing 0.4pp of return; they are picking on visibility, brand, or convenience
2 findings
OPE.O6
Stake pool operator profitability ranges from 24K to 1M ₳/yr — operators who charge the most earn the least
Operator revenue scales with fleet size, not price — the sub-reliable single-pool operator absorbs 48.3% of pool rewards for 24,820 ₳/yr, while an 11+ pool MPO absorbs 7.7% for 1,035,496 ₳/yr (42× more revenue at 6× less price). No single-pool operator in the retail market earns a competitive wage.
The operators who charge the most earn the least — and vice versa. A sub-reliable single-pool operator absorbs 48.3% of pool rewards but earns only 24,820 ₳/yr. An 11+ pool MPO absorbs only 7.7% of pool rewards but earns 1,035,496 ₳/yr — 42× more revenue at 6× less effective price. The flat fee penalises small-pool delegators without compensating the operators who run those pools — both sides of the small-pool transaction lose · MPO revenue scales horizontally (more pools), not vertically (higher price). The 11+ pool bracket captures 26.5% of retail rewards through 7 entities. Their per-pool fee is the same 170/340 ₳ floor everyone else uses — they win by running more pools, not by pricing differently. Fleet size, not pricing, drives MPO operator economics — meaning a reform that targets pricing leaves fleet revenue untouched
4 findings
OPE.O7
Delegation follows visibility, not return
Delegators do not chase yield — 65.9% sit in hollow MPO pools at 2.18% net return while hollow single-pool near-saturation peers offer 2.34%. The pledge premium is negative once the flat fee drag (1.06pp for balanced vs 0.47pp for hollow) is priced in.
Two thirds of retail delegators sit in pools that pay less than the alternative — yield is not what they are choosing on.65.9% of retail delegators sit in hollow MPO pools at 2.18% net return; hollow single-pool near-saturation pools offer 2.34% — 0.16pp more — and yet hold only 2.7% of delegators. Delegators are not chasing yield — they are picking on visibility, brand, exchange convenience, or default selection. The return signal does not drive delegation · The pledge premium is negative in the retail data — balanced operators deliver less net return than hollow ones. Balanced (genuine pledge commitment) operators deliver a median net return of 1.98%; hollow operators deliver 2.08%. The reason is mechanical: balanced single-pool operators incur a 1.06pp flat-fee drag vs 0.47pp for hollow ones, and that drag overwhelms whatever pledge premium the reward curve is supposed to add. The incentive mechanism's core assumption — that pledge commitment translates to better delegator outcomes — does not hold in the data
2 findings
OPE.O8
Reserve depletion is a structural clock: every epoch, the pot shrinks, the confiscatory zone widens, and yields erode
Reserve depletion is a structural clock built into the formula. Yield has fallen 5.3% → 2.0% in 413 epochs (R² = 0.99 with reserve), and the trajectory is irreversible without protocol-level intervention.
Concrete projections (from epoch 623, ~April 2026): ~12 months out (~Q2 2027) — yield at ~1.7%. ~20 months out (~Q4 2027) — yield crosses 1.5%. ~42 months out (~Q3 2029) — yield crosses 1.0%.
Each epoch the pot shrinks, the fixed-in-₳ flat fee consumes a growing share of pool rewards, and the retail yield spread compresses toward block-production noise. The failures documented in §4 don't stay still — they degrade every epoch by the same mechanical clock.
The delegator yield has fallen from 5.3% to 2.0% in 5.5 years and the decline is built into the formula. Yield has tracked reserve depletion with R² = 0.99 across 413 epochs. Projection from epoch 623 (~April 2026): ~1.7% within ~12 months, sub-1.5% within ~20 months (~Q4 2027), sub-1.0% within ~42 months (~Q3 2029). The decline is irreversible without protocol-level intervention — it is built into the monetary expansion formula. The entire yield surface descends as a unit; no pool-level strategy can offset the macro trajectory · The confiscatory zone expands upward every epoch — the failures in §4 are not static, they get worse mechanically. As the epoch pot shrinks, the flat fee (fixed at 170/340 ₳) consumes a growing share of pool rewards — the confiscatory zone from §4.1 — The flat fee (fixed cost) expands upward. The 0.39pp retail yield spread compresses proportionally: at 1.0% base yield (~Q3 2029), the same relative dispersion produces ~0.20pp — indistinguishable from block-production noise. Pools productive today will cross the sub-reliable threshold purely from macro depletion. The failures documented in §4 are not static — they degrade every epoch
3 findings
OPE.O9
Cardano's yield is no longer competitive — and the case for staking now rests on an ADA appreciation that hasn't materialised
At 2.0%, Cardano's delegation yield sits below the USD risk-free rate (4.3%) and at the bottom of the PoS chains' yield ladder. No other major chain combines this low a yield with liquid, non-custodial, slashing-free design.
The mechanism's design premise was that delegators stake because (i) the yield itself is meaningful and (ii) ADA appreciates in real terms (the formula's monetary design assumes deflation-like behaviour). Both assumptions are now under stress. The yield premise has empirically degraded (OPE.O8); and ADA has not shown the appreciation/deflation behaviour the formula was designed around — the case for delegation now rests almost entirely on a price thesis the protocol cannot guarantee.
If ADA fails to deliver real appreciation, the psychological effect compounds: delegators face low yield AND uncertain price, leaving only conviction-driven holders. The mechanism assumes yield-sensitive delegators; the regime now selects against them.
At 2.0%, Cardano sits below the USD risk-free rate and at the bottom of the PoS landscape. Cardano's current 2.0% delegation yield is below the USD risk-free rate of 4.3% and at the bottom of the PoS chains' yield ladder. No other major chain combines this low a yield with liquid, non-custodial, slashing-free design. The low return is the cost of that design — but the design now asks delegators to accept a yield below the risk-free rate, which only conviction-driven holders will do · The mechanism's premise depends on ADA appreciation that hasn't materialised — and if it doesn't, only conviction-driven holders remain. The reward formula was designed around a monetary regime where ADA itself appreciates (the reserve-depletion design implies deflationary-like behaviour as the supply approaches its cap). In practice, ADA price has not delivered that appreciation, leaving delegators with low yield + uncertain price. The mechanism's assumption — that yield-sensitive delegators allocate based on competitive returns — collapses to a self-selected pool of long-conviction holders, who do not respond to the formula's pricing levers. If the deflation premise fails, the psychological pressure compounds: there is no yield case AND no appreciation case, only a conviction case — which the formula cannot manufacture
2 findings
CEN.O1.F1
Three quarters of registered pools are economically irrelevant. 2,144 of 2,877 (75%) sit below the production threshold (~3M ADA) and together hold only 2.7% of stake
Structural threshold
The structural floor
CEN.O1.F2
Three quarters of productive stake sits in 83 named entities. They control 76.7% through 449 productive pools (71 strict multi-pool + 12 attributed single-pool) — and the count is a lower bound (operators using fully separate per-pool infrastructure stay invisible)
Concentration — supply side
SPO supply side — fewer and fewer entities participate in consensus
CEN.O1.F3
The pool count flat-lined since epoch 300; the equilibrium is replacement, not growth. The productive set tracks a 700–1,000 historical band (733 at epoch 623) with 1.7% turnover per epoch — 3,497 entries against 3,070 exits balance to near-zero net flow
Market maturity
The market has crystallised — replacement, not growth
CEN.O1.F4
Concentration is heavy-tailed: 12 entities run 41% of productive stake. Of the 83 attributed, 12 with 11+ productive pools control 41.0% (8.69B / 21.18B); the top 2 alone (Coinbase 41p, YUTA 25p) hold 13.4%
Scale dominance
The productive operator landscape — 733 pools, 367 entities
CEN.O1.F5
Custodial dominance sets a structural pledge floor. CEX + IVaaS (10 entities, 181 pools, 7.40B ADA, 34.3% of productive stake) operate at zero pledge by architectural constraint — custodied retail balances cannot legally be pledged
Custodial constraint
The productive operator landscape — 733 pools, 367 entities
CEN.O1.F6
Independent operators are losing the field — 48% pool-count loss in 323 epochs. Single-pool operators contracted from 555 pools / 39.1% of productive stake (epoch 300 peak) to 291 / 24.4% (epoch 623); the contraction has accelerated in the most recent window
Structural decline
The market has crystallised — replacement, not growth
CEN.O1.F7
Multi-pool entities absorbed the contraction and then some — fleet count nearly quadrupled. From 23 entities / 135 pools / 65% of stake (epoch 210) to 85 / 660 / 75.6% (epoch 623); the mid-tier (6–20 pools) tripled in entity count and nearly doubled in stake share
Entity expansion
The market has crystallised — replacement, not growth
CEN.O1.F8
The mechanism's designed progression path is invisible in the data. Entry → growth → established is supposed to feed the independent segment; instead the independent population is contracting and the replacement pools that maintain the productive total are entity-operated
Pipeline failure
The market has crystallised — replacement, not growth
CEN.O1.F9
On-chain attribution alone misses the bulk of fleet structure — 4 entities vs 85, a ~20× jump. Most multi-pool operators use separate keys per pool, so on-chain ownership clustering catches only the small minority that doesn't separate keys; any analysis stopping at the on-chain layer materially understates MPO concentration
Methodological — attribution layer matters
Behind the pools — entity attribution layers 4 on-chain entities into 85
CEN.O2.F1
A single Titan delegator moving in or out can shake a whole pool — whale-funded pools swing ~±20% between epochs vs ±8% for retail. In the 28 custodial-by-delegation pools (typical delegator holds ≥ 100K ₳), stake moves by roughly ±20% between epochs, with 21% of them swinging by more than 50% — these are pools where a single address is large enough that its movement dominates the variance. Retail (809 pools, broad small-delegator base) is mostly stable (±8%) — no single delegator can move the pool. Custodial-by-extraction (79 pools, ≥99% margin) is the most inert (±7%) — stagnation, not active management
Segment-driven variance
A pool's stake stability is segment-driven
CEN.O3.F1
Half the delegator base stakes less than a single transaction fee at peak congestion. Median: 32 ADA. Mean: 16,055 ADA. The 500× gap measures the skewness of a power-law distribution where each tier above 10K ADA holds roughly 20% of total stake despite containing exponentially fewer delegators
Structural inequality
Half the delegator base stakes less than a transaction fee
CEN.O3.F2
The delegator population's stake is concentrated in its top 0.07%. 1,000 delegators (0.07% of the 1.36M population) hold 57% of staked ADA; the top 10,000 (0.74%) hold 79.2%. Gini = 0.976 — more concentrated than US wealth (~0.85) and comparable to the most unequal asset distributions observed in financial markets
Concentration — demand side
Half the delegator base stakes less than a transaction fee
CEN.O3.F3
Concentration crystallised by epoch 300 and has not moved since. A 9× growth in delegator count has not budged the top-1% share (locked at 78–82%) — new entrants are overwhelmingly micro-delegators (<1K ADA, 96% of new joins) who inflate the denominator without touching the numerator. The economic weight of staking was set in its first ~90 epochs
Structural lock-in
Concentration crystallised by epoch 300 — 9× growth in delegators, no change in the top-1%
CEN.O4.F1
Pool-switching collapsed 75% from early Shelley. Redelegations fell from 2,000–3,500 per epoch (early Shelley experimentation) to 600–800 today — three regimes: experimentation (epochs 210–260) → middle period with hard-fork spikes (260–500) → mature settled market (500+)
Market maturity
The certificate stream tells a three-act story
CEN.O4.F2
The base splits cleanly into stickers and switchers, with a thin middle. 42% loyal (201+ epochs, > 2.7 years), 21% volatile (≤ 5 epochs, < 25 days), 37% moderate. The loyal majority anchors pool economics; the volatile tail generates the bulk of the churn signal
Structural bimodality
Most delegators stay put — 42% have held the same pool 2.7+ years
CEN.O4.F3
Switching is a retail-market phenomenon — custodial and private pools contribute negligible churn. A retail-only filter (margin < 99.9%, excluding by-pledge / by-extraction custodial) produces near-identical aggregates: 40.0% switch rate, 42.4% loyal tenure, ~799 redelegations per epoch
Churn is retail-only
Switching is a retail-only phenomenon
CEN.O5.F1
Whales switch 4–5× more often than micro-delegators. Lifetime switches: <1K = 0.67, 1K–10K = 0.95, 10K–100K = 1.64, 100K–1M = 2.65, 1M+ = 3.06. Loyal share (201+ epochs): <1K = 82%, 1M+ = 39%. Switching intensity scales monotonically with stake size — small delegators delegate once and forget; large delegators actively manage their position
Size-driven behaviour
The bigger the delegation, the more it moves
CEN.O5.F2
Most of the network's staked capital sits in delegations that move. Whales (1M+) hold 14.1B of the 21.8B staked total (65%), yet only 38% of that stake sits in loyal (201+ epoch) delegations — the rest distributes across moderate and volatile tenures. Pool operators dependent on a few large delegations face structurally higher stake instability than those with a broad base of small loyal delegators
Capital instability
Loyalty and low fees coexist
CEN.O6.F1
Delegators cannot see what they're paying for — the yield signal is too flat to act on. Half of all switches (50.5%) produce zero yield change (±5 bps); the median ROS differential is +0.02 bps with an interquartile range of −0.47 to +0.55 bps. The signal is an order of magnitude below any threshold a delegator could observe, let alone optimise against
Price signal invisible
Half of all switches produce zero yield change
CEN.O6.F2
Operator take direction is balanced — no fee-chasing pattern is detectable. 30.8% of switches go to a cheaper pool, 31.5% to a more expensive one, 37.7% land at the same take. The take × ROS matrix's diagonal dominates (lower take → better ROS at 18.4%, similar → similar at 25.6%, higher → worse at 16.5%) — confirming take and ROS are two views of one signal, and that signal is too flat to drive behaviour
No fee-chasing
Operator take direction is balanced — no fee-chasing
CEN.O6.F3
Pool size — not price — is the only asymmetric signal in switching behaviour. Moves to smaller pools tend to accept higher take (21.5%), moves to larger pools tend to stay take-neutral (21.0%). The asymmetry suggests moves toward small pools follow non-economic factors (community affinity, retirement at origin, decentralisation preference); moves toward larger pools follow a path of least resistance — visibility, not optimisation
Visibility over optimality
Pool size — not price — is the only asymmetric signal
CEN.O6.F4
Loyalty and low fees coexist — the cheapest pools are the stickiest. 92.1% of loyal delegations (201+ epochs) sit in the 0–5% margin range. Loyalty is a consequence of initial pool selection into the competitive neighbourhood, not a barrier to leaving it; fees segment the market at entry, not during tenure
Entry filter, not trigger
Loyalty and low fees coexist
CEN.O6.F5
DeFi operates almost entirely outside the staking system. 99.97% of delegations and 99.83% of stake are key-based; script-based delegation (smart contracts, multisig, governance) is 399 addresses and 38M ADA. The DeFi ecosystem has not integrated with delegation in any meaningful way — and the credential type cannot separate custodial from retail capital, since both present as key-based
No smart-contract staking
DeFi operates almost entirely outside the staking system
CEN.O7.F1
The staking rate is structurally declining despite persistent net delegator inflows. The rate has fallen from 71% (epoch ~260) to 59% (epoch 623) — a 12 pp loss over ~360 epochs. Circulating ADA grew from ~32B to ~37B while staked ADA grew from ~23B to only ~22B; the non-participant pool is growing faster than the staking pool.
Supply-side erosion
CEN.O7.F2
14.36B ADA (39.8% of circulating supply) does not participate in staking — and only a sliver of that is reachable by reward design. The non-participant pool has been stable at 36–39% for over 300 epochs. Only 0.37% of circulation (134.6M ADA, 24,176 accounts) is nominally addressable by an incentive-design change — and even that figure shrinks under scrutiny (§5.5). The remaining 39.4% sits in addresses that cannot delegate without a protocol-level change.
Structural non-participation
2/5 of the supply has sat unstaked for over 300 epochs
CEN.O7.F3
The non-participant floor is structural, not behavioural — incentive changes alone cannot reach 99% of it. Reward-mechanism changes (curve adjustments, fee-structure reforms) can at most shift the 0.37% addressable pool. Moving the other 39.4% requires protocol-level changes — enabling exchange-style addresses to stake, mandating staking-capable DeFi script standards, or introducing delegation-by-default for newly minted wallets.
Structural protocol limit
Most non-participants have no staking key
CEN.O7.F4
The "no staking key" residual is dominated by legacy and custody, not by active DeFi. Among the 2.45B identified by address shape, exchange-style addresses (1.04B) and pre-staking-era legacy addresses (1.32B) together account for 96%. DeFi contract addresses without staking total just 91M — one tenth as much, growing only slowly. The remaining ~11.8B sits in standard wallets where the holder never bothered to register a staking key. The unreachable mass is overwhelmingly inertia, not active opt-out.
Composition — legacy not DeFi
Most non-participants have no staking key
CEN.O7.F5
The no-staking-key pool is bimodal: 37% is pre-staking-era dormant, 44% is from the last 73 epochs — the middle is empty. The dormant fraction (928M) erodes at about 0.8M ADA per epoch as wallets occasionally awaken. The recent fraction (1,110M from epochs 550–623) reflects active exchange and DeFi cycling. The middle eras are essentially spent — the population splits cleanly into probably lost and operationally active, with very little in between.
Bimodal — dormant vs operationally active
The locked share splits cleanly between probably-lost and operationally-active
CEN.O7.F6
The structurally-excluded 2.5B is held by a few hundred wallets, not by a diffuse retail base. Top-3 wallets control 19.1%, top-10 control 41.6%, top-200 control 68.9% of the 2.5B residual. The top of the distribution splits into recognisable archetypes — exchange hot wallets, institutional cold storage, pre-staking-era legacy holders — addresses that can be named, not anonymous retail. Any policy aimed at this pool acts on a small, identifiable counterparty list.
Concentration of structurally-excluded ADA
A few hundred custodians hold three-quarters of the structurally-excluded ADA
CEN.O7.F7
DeFi-locked-without-staking is a one-contract problem, not an ecosystem problem.89% of the 91M residual lives in one 80M-ADA contract; the remaining 99 contracts together hold ~10M (11%). Mandating staking-capable contract addresses in DeFi standards would primarily move that one contract — the rest of DeFi has either already integrated staking or holds amounts too small to materially shift the residual.
DeFi exclusion is a one-contract problem
The DeFi-locked share is one contract
CEN.O7.F8
The "addressable" pool is mostly inert — the real ceiling for reward-driven recruitment is 0.06% of circulation, not 0.37%. Of the 24,176 nominally-addressable accounts, 91% hold zero ADA, 89% have been dormant since the first 41 epochs of Shelley, and 80% of the residual ADA sits in one DeFi vault. The genuine ceiling for reward-driven re-engagement is ~22.5M ADA (0.06% of circulation), spread across ~2,100 active accounts. The reward mechanism's recruitment ceiling is narrower than the headline 0.37% suggests by an order of magnitude.
Real ceiling on reward-driven recruitment
The "addressable" pool collapses to about 2,100 active accounts
CEN.O8.F1
The submitter population peaked at 790K addresses and has since contracted by 96% — the chain runs busily, with a much smaller crowd. The population grew in step with transaction count through early Shelley, peaking at 790,335 unique addresses and 1,566,974 transactions at epoch 304 (the CNFT minting frenzy). From epoch 310 onward the population collapsed faster than volume: 101K submitters at epoch 384, 58K at epoch 500, 31,176 at epoch 627. Transaction volume fell only 92% over the same window — a population one twenty-fifth of its peak still sustains three quarters of the per-epoch transaction rate seen during 2023–2024.
Population contraction
A shrinking crowd paying for a busy chain
CEN.O8.F2
Breadth is collapsing while per-actor intensity is rising — the same shrinking core just transacts more often. The address-to-transaction ratio fell from 0.88 (epoch 210) to 0.26 (epoch 627), and tx-per-submitter rose from ~2.0 (epoch 304) to ~3.8 (epoch 627). Cumulative Shelley-era throughput totals 118.07M transactions and 37.85M ADA in fees. The growth-trajectory signal is unambiguous: new addresses are not entering the fee-paying population at a rate that would sustain breadth — the same shrinking core is just transacting more often.
Same shrinking core, more active per-member
A shrinking crowd paying for a busy chain
CEN.O9.F1
By address count, the submitter population remains overwhelmingly stakeable — but the script segment has grown structurally. At epoch 627: 73.3% base-key (addr1q) addresses carrying a stake credential, 10.8% base-script (addr1z), 9.2% enterprise-key (addr1v), 4.9% legacy Byron, 1.6% enterprise-script (addr1w), 0.2% base-other. Compared to the earlier snapshot at epoch 384 (87% base-key, <1% script), the shift is clear — base-key dropped 14 pp while base-script grew from 0.4% to 10.8%. The count-based picture remains misleading: the small script population punches far above its weight in fee terms.
Headcount remains overwhelmingly stakeable
Most submitters can stake — but the loudest of them can't
CEN.O9.F2
Roughly 30% of fee revenue is generated by addresses that structurally cannot delegate, and this share has been stable since Alonzo. Over the recent 6-epoch window (622–627): enterprise-script (addr1w) 17.0%, enterprise-key (addr1v) 10.8%, legacy Byron 2.3% — totalling 30.1%. The non-stakeable fee share has oscillated between 18% and 44% since epoch 300, averaging ~25%; the structural floor is set by DeFi contract activity, the ceiling by speculative episodes. At no point since Alonzo has it fallen below 14% — the reward mechanism taxes a constituency it excludes.
The fee base is structurally misaligned with the reward base
Most submitters can stake — but the loudest of them can't
CEN.O10.F1
Script transactions are 12.5% of post-Alonzo count but 29.6% of cumulative fees — the DeFi economy pays a 2.4× per-transaction premium. The premium peaked above 3× during the Alonzo era (epochs 310–340), when fewer than 30% of transactions commanded over 60% of fees. It has moderated to ~1.5× in recent epochs but remains structurally above parity. For the sustainability argument, this means per-transaction fee intensity is coupled to script adoption — a variable the current incentive design does not address.
DeFi subsidises the epoch pot
~3,800 smart contracts carry a third of the fees
CEN.O10.F2
At epoch 627, ~3,800 script addresses (12% of submitters) generate 36% of fee revenue — the pipeline depends on the continued operation of these contracts. Specifically: 490 enterprise-script + 3,361 base-script = 3,851 actors (12.4% of the submitter population) generated 14,481 ADA in fees — 36.0% of the epoch total. The per-address rate of an enterprise-script submitter (12.1 ADA/epoch) is 14× that of a base-key submitter (0.83 ADA/epoch). The script population grew sixteen-fold since epoch 384 (0.7% → 12.4%) while their fee share held steady around one third — the per-address premium has moderated but the structural dependency has deepened.
Concentration on script activity
Most submitters can stake — but the loudest of them can't
CEN.O11.F1
The top 10 addresses pay 20% of all fees; the top 500 (out of ~147K) pay 58%. Over epochs 622–627, 500 addresses out of ~147K (0.34%) pay the majority of fees. Concentration is heavy-tailed but less extreme than delegation stake (Gini 0.976). Compared to the prior 618–623 window (top-10 = 24.3%, top-500 = 60.8%), the recent window shows a mild de-concentration of 4 pp at the top — driven by a single very-high-volume address whose activity tapered. The fee base sits on a few hundred high-frequency automated actors, not a diffuse retail tail.
High-frequency automated actors (DEX aggregators, exchange hot wallets, arbitrage bots)
The fee floor rests on a few dozen recognisable names
CEN.O11.F2
The top 10 fee payers ran 110,739 transactions over 6 epochs (16.1% of volume) — fee-pot stability hinges on a population small enough to know by name. The top 50 ran 219,720 transactions (32.0%) over the same 6-epoch window. The top fee payers are dominated by recognisable archetypes: a MinSwap DEX-script address leads at 12,105 ADA over 6 epochs; pools tied to NUFI (NuFi exchange-style operator), TITAN, BERRY, and OYSTR appear among the top 10 alongside enterprise-script DEX contracts and bot wallets. The fee floor of the network depends on a population of ~10 actors whose churn risk is not modelled by any incentive parameter.
Single-actor exposure
The fee floor rests on a few dozen recognisable names
CEN.O12.F1
Only 41.8% of fee revenue comes from currently-delegating addresses; the remaining 58.2% comes from addresses outside the delegation set at the snapshot epoch. Across epochs 622–627, the 1.352M delegators at epoch 627 contributed 41.8% of fee revenue (92,538 ADA out of 221,565). The stakeable-but-inactive segment (base addresses whose stake credentials are not in the delegation set) contributed 28.1% (62,340 ADA). The structurally non-stakeable segment (enterprise + legacy) contributed 30.1% (66,684 ADA). The mismatch is symmetric on both sides — the funding base does not match the reward base.
Fee base ≠ reward base
The people who pay are not the people who get rewarded
CEN.O12.F2
Only 3.1% of delegators submit any transaction in a 6-epoch window — 96.9% of delegators are passive holders. Of the 1,352,113 active delegators at epoch 627, only 42,082 appear as the first input of any transaction during epochs 622–627 (a 30-day window). The remaining 1,310,031 (96.9%) hold stake, accrue rewards, and never touch the chain. From the other side, the submitter base has 76,561 unique stake credentials over the same window, of which 42,082 (55.0%) are in the delegation set — the rest carry a stake credential that has never been delegated, has been deregistered, or sits idle.
Delegators are passive; submitters are a different population
The people who pay are not the people who get rewarded
CEN.O12.F3
In the top 500 fee-paying addresses, the largest segment by fee weight is the population the reward mechanism cannot reach. Top-500 split: no-stake-cred 39.4% (213 addresses, 50,960 ADA), delegating 39.2% (161 addresses, 50,685 ADA), has-cred-not-delegating 21.4% (126 addresses, 27,728 ADA). The pipeline's largest fee contributors are concentrated in the population it cannot reward — half of the heavy-paying actors are structurally outside the delegation game by design (DEX scripts, exchange enterprise wallets), and another fifth are technically inside but have opted out. Any fee-redistribution mechanism that passes value through the delegation channel returns less than 40 ADA in every 100 ADA of fees to the population that paid them.
Heavy-paying actors are concentrated outside the delegation channel
The people who pay are not the people who get rewarded
TRE.O1.F1
Monetary expansion is the only material input to the pot — supplies ~99.8%, every epoch, since Shelley. Outside a single recent anomaly at epoch 620 (~5% fee share), fees have never crossed 3% — even during peak NFT/DeFi activity. The pot's trajectory is therefore tied almost entirely to reserve stock and ρ; the formula admits three sources but the mechanism behaves as if it had one
Structural — unchanged since Shelley
Epoch pot composition
TRE.O1.F2
Fee revenue is structurally insufficient — closing the gap requires fee revenue to grow ~100× (two orders of magnitude). Fees contribute ~0.17% of the pot at epoch 623, and even the realistic capacity ceiling (~254K ADA/epoch at 3.1 TPS × 432K s × 0.19 ADA/tx) covers only ~1.3% of the reserve expansion term (~19.23M ADA). Closing the gap requires a throughput upgrade (Leios), a structural shift in transaction demand, and higher per-tx pricing (no single lever suffices); until that crossover, the second source named in the SL-D1 formula is a rounding error
Structural — ~100× fee-revenue gap
Transaction fees
TRE.O1.F3
The deposit channel is small and unmeasurable at epoch granularity. Koios exposes a stock-level obligation series (~5.44M ADA average, max 9.26M ADA at epoch 574) but not the per-epoch non-refundable flow that actually enters the pot. Cross-validation against treasury stock deltas leaves a median gap of only ~49K ADA over epochs 211–623 — a rounding error against a pot of ~19M ADA. The third source in the SL-D1 formula is real on the balance sheet but invisible in the budget
Data limitation — Koios coverage
Deposit obligations
TRE.O1.F4
Stake pool operators assemble the pot reliably — block production is not the bottleneck. The cooperative-behaviour gate \min(η, 1) has averaged 0.977 since Shelley and dropped only as low as 0.896 during a single infrastructure stress event (epoch 347). The clamp has activated in only 7 epochs out of 413. Whatever else constrains the budget, the supply-side cooperation the formula nominally polices is not it — the gate is satisfied but never binding
Structural — avg η = 0.977
Block-production ratio (η)
TRE.O2.F1
The reserve is half-depleted in 5.7 years and the nominal expansion has already halved. Stock has fallen from 13.29B → 6.45B ADA (a −51.43% decline) over ~5.7 years; the nominal monetary draw has dropped from ~39.9M → ~19.36M ADA/epoch. Because the formula draws a fixed 0.3% of remaining reserve, the decay is exponential — the absolute pot keeps shrinking even when participation does not. The single-source budget identified in TRE.O1 is now visibly thinning, on a schedule the formula cannot reverse
Structural — exponential decay
Reserve stock and monetary expansion
TRE.O2.F2
Significant reward pressure begins at epochs 1000–1200 (~2028–2029). At current parameters and participation, the reserve reaches ~2B ADA in this window — at which point per-epoch rewards drop materially. Full depletion is projected around epoch 3500 (~2040s). The window for governance to intervene before the pot becomes too small to incentivise meaningful staking is on the order of 3–4 years
Projected — ~2028–2029
Reserve depletion trajectory
TRE.O3.F1
Less than half of the pools pot reaches its intended recipients. Of the 15.39M ADA allocated to the pool side at epoch 623, only 6.78M ADA (~44%) is distributed to operators and delegators; the remaining ~8.61M returns to the reserve. The mechanism therefore operates at less than half of its design throughput in steady state — the SL-D1 distribution rules are intact, but the pool-by-pool conditions for full payout are not met across most of the landscape
Epoch 623 — 6.78M of 15.39M ADA
Return to reserve
TRE.O3.F2
Cumulative undistributed rewards account for roughly three quarters of the current reserve stock. Over 413 epochs the return-to-reserve channel has accumulated 4.61B ADA — about 71% of the 6.45B ADA the reserve holds today. This buffer is a side-effect of incomplete distribution, not a design feature: the reserve has lasted as long as it has largely because the system has been failing to pay out. Any reform that improves distribution efficiency therefore accelerates depletion
Structural — side-effect, not design
Return to reserve
TRE.O3.F3
Inactive stake (~43.6% of supply) is the dominant driver of the distribution gap. Out of ~38.55B ADA in circulation, only ~21.75B (~56.4%) participates in delegation; the remaining ~16.8B ADA (~43.6%) earns no rewards but still dilutes the per-ADA share. The decomposition attributes ~70.9% of cumulative return-to-reserve to this non-participating capital. The lever sits upstream of the formula — it is a participation problem, not a distribution-rule problem
Upstream — outside formula control
Return to reserve
TRE.O4.F1
Treasury rate (τ = 20%) and monetary expansion rate (ρ = 0.3%) have never been adjusted since Shelley. Both parameters were set on 2020/07/29 and have remained at their day-one values across ~5.7 years of mainnet operation. Decentralisation d was gradually reduced to 0 (epochs 208–257) and k was raised from 150 to 500 (Aug 2020) — but the reward-level parameters that drive every quantity in this section remain frozen, and neither has been the subject of a formal governance proposal
Governance — τ = 20%, ρ = 0.3% constant
Protocol parameters
POL.O1.F1
Less than half the pool pot reaches its targets. Only 6.79M of the 15.53M ADA per epoch budgeted for distribution actually reaches operators and delegators — a 44% distribution efficiency. The other 56% returns to the reserve unused
Epoch 616
Current snapshot
POL.O1.F2
ADA that isn't staked at all is the single largest source of waste. Every epoch, 4.91M ADA is forfeited because roughly a third of the supply sits unstaked — that's 31.6% of the pot, returned to the reserve before the formula even gets a chance to distribute it
Upstream — outside formula control
Overview
POL.O1.F3
Almost all of the pledge-bonus budget is wasted. Every epoch, 3.43M ADA earmarked as the pledge bonus returns unclaimed — 22.1% of the pot and 95.6% of the bonus allocation. Unlike the participation gap, this loss is entirely within the formula's control
Addressable by formula reform
Why pledge matters — and why this is not zero-sum
POL.O1.F4
Two causes account for almost all the waste; everything else is rounding error. The participation gap and the unused pledge-incentive budget together return 53.7% of the pot to reserve. The remaining sources combined — pledge-not-met confiscation (2.1%), missed blocks (0.5%), oversaturation (0.3%) — add up to less than 3% of the pot
The reform priority is clear
Current snapshot
POL.O2.F1
Almost no operator pledges meaningfully.78% of staked ADA sits in pools where the operator pledges less than 1% of the stake they manage; the stake-weighted median pledge ratio is 0.07%
Empirical — pledge is absent where stake concentrates
The evidence on mainnet
POL.O2.F2
Pledging earns less than passive delegation, even at maximum scale. A fully-saturated pool whose operator pledges the entire saturation amount earns just 0.68%/yr on that pledged capital — below the 2.3%/yr anyone can earn by passively delegating
Economically irrational to pledge
The playing field: what pledge actually buys
POL.O2.F3
The pledge bonus budget goes unused.3.4M ADA every epoch — 22% of the pool pot — is reserved for the pledge bonus, but the formula's distribution mechanics return almost all of it to the reserve unclaimed
Structural cost of maintaining a₀ = 0.3
Current snapshot
POL.O2.F4
Small pools cannot earn meaningful pledge bonus, no matter how committed the operator. The formula scales the bonus by pool-size squared (ν²) before pledge is priced — at every pledge ratio. A pool at 10% of saturation is structurally capped at 1% of the bonus a saturated pool earns, regardless of operator commitment
Algebraic — pre-empirical
The envelope mechanics — and the three structural defects of A
POL.O2.F5
Pledging more pays less past a sweet spot — for almost every pool on mainnet. For any pool below half-saturation, the bonus peaks at an interior pledge ratio π^ = 1/[2(1-ν)] < 1, and pledging beyond that point reduces the bonus. At ν = 0.3 the peak sits near 71% pledge ratio, and full self-pledge pays 16% less than the peak. The formula formally rewards operators for under-committing*
Algebraic — pre-empirical
The envelope mechanics — and the three structural defects of A
POL.O2.F6
The strongest possible commitment signal is paid the worst-case reward. When the operator pledges 100% of their own pool (π = 1), the bonus collapses to pool-size cubed (ν³). A half-saturated pool earns 12.5% of the maximum bonus; a pool at 10% of saturation earns just 0.1%
Algebraic — pre-empirical
The envelope mechanics — and the three structural defects of A
POL.O3.F1
The production threshold is physics-based — emergent from slot-leadership, not a parameter. At today's active stake (~21.18B ADA), regular block production starts at ~3M ADA, the stake level at which a pool has a 95% probability of producing at least one block per epoch (λ=3 in the Poisson process) — the point where yield is usable as a delegator signal. The 1-block-expectation point (~0.97M ADA) is a special case at the bottom of the regime: below it, pools have less than one expected block per epoch and rewards are noise, not signal. The threshold rises with active stake — at full supply (~38.5B ADA), the 3-block point climbs to ~5.35M ADA, pushing more pools below it
Physics — emergent, not a parameter
Production threshold
POL.O3.F2
Operator-viability is volatile and tracks the ADA/USD price; at today's prices it coincides with the production threshold, but separates upward when ADA falls. A single-pool operator needs to extract roughly 390 ADA/epoch today (~7,160/yr cost floor — infrastructure ~1,320–3,240/yr + DevOps labour ~5,160/yr min — at0.25 ADA). At the production threshold (~3M ADA stake), the pool generates ~2,145 ADA/epoch on average, more than enough — viability and production coincide. At lower ADA prices the cost in ADA rises, and the reliable-income floor rises above production. The threshold is therefore not drawn as a fixed line in the rest of this document; it is treated as a separate volatile concept whose stability is a question for the V2 spec, not the diagnostic
The saturation cap is a formula ceiling — z₀ = 1/k. At k = 500, z₀ = 77M ADA. Beyond it, the per-pool reward stops scaling with stake. The cap exists to limit any single pool's share of the network's reward — a per-pool anti-Sybil device, fixed by parameter
Formula — fixed by parameter
Saturation threshold
POL.O3.F4
The cleaner future state collapses viability into production. Zeroing minPoolCost (or making it scale with the reward curve) removes the protocol-imposed floor, but the real labour-cost floor remains and viability stays above production unless a structural mechanism is introduced — e.g., a Rocket-Pool-style shared-operations path that lets sub-scale stake fund a single operator. The §1.2.4.4.1 Enforce the production threshold proposal pairs both: a minPoolCost reform AND a sub-threshold path for stake that cannot reach the production line on its own
Design intent — simplification path
Conclusion
POL.O3.F5
Tier boundaries are dynamic — they shift with active stake, fixed costs, and k. When a CIP proposes k = 1000, the saturation threshold halves to ~38.5M and every "Large healthy" pool reclassifies as near-saturation. When active stake grows from 21B to 35B ADA, production and viability lines rise proportionally. The taxonomy is a framework for reasoning across scenarios, not a snapshot of today's values — reform evaluation must track where the boundaries move
Framework — not a snapshot
Conclusion
POL.O4.F1
1,987 pools (73%) sit below the production threshold (~3M ADA) and produce blocks too sporadically to carry consensus reliably. At the production threshold a pool has a 95% probability of producing ≥1 block per epoch (λ=3); below it Poisson noise dominates and yield is statistical noise. Collectively these pools hold only 2.7% of active stake — ghost capacity the protocol admits but cannot reliably activate; neither delegators nor the consensus layer can read a meaningful signal from any single pool in this segment
Empirical — sub-block tail
Pool distribution by tier
POL.O4.F2
The productive segment (731 pools, 27%) holds 96.6% of staked ADA — the actual consensus-carrying population. This is the segment any reform of k, the pledge curve, or the saturation cap actually moves. Pool count is not stake share: the inversion of headline pool count vs. stake share is the defining structural feature of the landscape
Empirical — productive segment
Pool distribution by tier
POL.O4.F3
The productive segment cannot be read pool-by-pool — it must be read at the entity level. Many of the 731 productive pools are operated as fleets by a smaller set of entities; pool-by-pool analysis of the upper tail conceals the actual concentration and over-counts independent actors. The pool view tells us how much stake is productive; only the entity view tells us who controls that stake and who responds to the pledge signal. The entity-level breakdown — counts, archetypes, pledge stances — is the subject of POL.O5 — entity-level analysis
Methodological — entity lens required
Conclusion
POL.O5.F1
Three quarters of the network's productive stake sits in 83 named entities. They operate 449 productive pools (≥3M ADA at epoch 623, the production threshold) holding 16.24B ADA — 76.7% of productive stake. 71 are strict multi-pool fleets; 12 are single-pool operators attributed by ticker, metadata, or relay clustering. The remaining 23.3% (4.94B ADA across 284 pools) sits in unattributed single-pool operators — attribution is a lower bound
Structural — concentration
Attribution method and headline figures
POL.O5.F2
48 MPO entities concentrate 14.55B ADA — 68.7% of productive stake — in operators each big enough to fill a saturation cap. These are the saturation-scale MPOs (aggregate stake ≥ z₀ ≈ 77\textM ADA). Concentration at the entity tier is sharper than the 76.7% headline once the 35 sub-saturation entities (1.69B ADA, multi-pool by form but single-pool-like in economics) are stripped out. The top 5 of the 48 alone hold 5.44B ADA — 25.7% of productive stake (Coinbase, CHUCK BUX, Figment, Binance, Kiln); the top 10 hold 39.1%. The split is purely structural — pledge is taken up next
Entity-tier concentration — 68.7% of productive in 48 actors
The scale-class divide
POL.O5.F3
Among the 48 saturation-scale MPOs, 42 are zero-pledge. They sit below the 2% pledge ratio bar and forfeit ~556K ADA/epoch (~40.6M/year) in pledge bonus rather than lock capital that would qualify for it. The responsive middle is tiny: 1 marginal, 3 compliant, 2 exemplary. The pledge gap is universal among saturation-scale MPOs; the bonus penalty (~11–21% of maximum reward for the largest offenders) is a modest tax on operators of multi-million-ADA fleets — not a deterrent
Mass zero-pledge
Pledge compliance classification
POL.O5.F4
Architecture explains 10 of those 42 — exchanges and institutional validators legally cannot pledge. CEX (6 entities, 119 productive pools) + IVaaS (4 entities, 54 productive pools) hold 7.39B ADA — 34.9% of productive stake — at architecturally zero pledge. Exchanges custody retail balances; institutional validators run client assets they do not own. Pledging this capital is precluded by the legal/business model, not chosen — no parameter change moves this stake into the pledge game
Architectural barrier — partial explanation
Architectural zero-pledge — CEX and IVaaS
POL.O5.F5
The remaining 32 sovereign MPOs choose not to pledge — they hold 4.80B ADA (22.7% of productive stake) that could enter the pledge game but doesn't. After excluding the 10 architecturally-barred CEX+IVaaS entities, 32 saturation-scale MPOs remain in the zero-pledge bucket — community-branded fleets, independent multi-pool operators, multi-brand fleets, opaque fleets, ecosystem stewards. They have no architectural barrier; they could lock capital and capture the pledge bonus. They don't. This is strategic abandonment, not custodial constraint — and it is the share of the MPO landscape any incentive reform must actually address
Strategic abandonment
The sovereign-MPO puzzle
POL.O5.F6
The mechanism's exemplary signal rests on one private entity. Only two MPO entities clear the ≥80% pledge bar at epoch 623 — Cardano Foundation (99.1%) and Adalite Platform (93.0%). CF pledges by institutional mandate, not economic incentive; remove it and the exemplary band collapses to a single private actor. A Sybil-resistance tool designed for 500 pools is, in practice, a transfer programme for one private entity
Exemplary collapse
The cost of zero-pledge
POL.O5.F7
Zero-pledge dominates every viable tier — no single-tier reform reaches it. Among saturation-scale MPO productive pools, 85.5% of stake (12.44B of 14.55B ADA) sits in zero-pledge pools, and that stake spreads across Healthy, Large healthy, Near-saturation, and Saturated/Oversaturated. A reform targeting one tier leaves the others untouched and propagates secondary effects everywhere; any change reshapes the whole landscape, not just the segment it targets
Reform constraint
Pledge compliance × pool tier
POL.O6.F1
The competitive field of single-pool operators is 3× smaller than the Incentive Mechanism Analysis headline. Lopez de Lara reported 741 'healthy' pools as evidence of a functioning incentive landscape; once MPO fleet members are stripped out, only 284 single-pool operators remain. 61% of the headline were fleet pools — operating under entity-level strategies (delegation source, fee setting, pledge), not the single-pool economics the headline was supposed to be about
The competitive field is 3× smaller than headline
Reassessing the *Incentive Mechanism Analysis* landscape
POL.O6.F2
At single-pool scale, pledging is rationally priced as not worth it.80.6% of single-pool productive stake (227 of 284 pools) sits in pools whose self-pledge is less than 2% of the stake they manage — call this zero-pledge: the operator has effectively declined the pledge bonus. The economics explain why: at single-pool scale, locking own ADA into the pledge yields at best 0.68%/year while passive delegation pays ~2.3%/year, so the pledge is dominated by the alternative use of capital at every realistic ratio. These operators are not failing to pledge — they are correctly responding to a formula that prices their effort below the delegation alternative.
Rational zero-pledge
Pledge compliance and the policy-sensitive population
POL.O6.F3
Only 51 single-pool operators (18% of the 284) pledge a non-trivial fraction of their stake — and that small group is the entire population a parameter reform could move. "Marginal" here means pledge ratio between 2% and 30% — operators who have engaged with the bonus but are not capturing it meaningfully (bonus capture scales roughly linearly with pledge ratio, so a 2–30% pledge captures only 2–30% of the available bonus). They hold 685M ADA — 13.9% of single-pool productive stake. Everyone outside this band is either above the bar already (≥30%, very rare at single-pool scale — 6 operators total) or below it (zero-pledge — bonus not worth the opportunity cost); so any parameter reform that aims to move pledge upward has only this 51-operator middle to work with
Target for parameter reform
Pledge compliance and the policy-sensitive population
POL.O6.F4
Single-pool operators are quietly losing ground — the segment is shrinking, but its pledge mix is not improving. Single-pool operators' share of active stake fell from 28.0% to 25.0% since epoch 583 (a 3 percentage-point loss in 35 epochs). Inside the segment, the split between zero-pledge / marginal / compliant operators has barely moved across the same window — the decline is in volume, not in behaviour. Capital flowed away from single-pool operators toward MPO fleets; the operators who remained kept the same pledge mix
Slow structural decline
Historical evolution — has the single-pool landscape always looked like this?
POL.O7.F1
The pledge mechanism's actual reach is 36% of active stake — 7.89B ADA. Strip out the entities that don't respond to the pledge signal, and what remains (single-pool operators + the few MPOs that do pledge meaningfully) carries 7.89B ADA out of ~21.7B active. The other 13.89B ADA — 65.6% of productive stake — is held by entities the bonus does not reach. The mechanism was designed to discipline operator behaviour across the whole network; in practice it operates on roughly a third of it.
The actual incentive-responsive arena
The pledge mechanism's actual reach
POL.O7.F2
MPO non-response splits into three distinct populations — confusing them is what keeps reform from working.Architectural: 10 entities (CEX + IVaaS) holding 7.39B ADA that cannot pledge by law/business model — exchanges custody retail balances, institutional validators run client assets they don't own. Strategic: 32 sovereign saturation-scale MPOs holding 4.80B ADA that could pledge but choose not to — at their scale the bonus pays less than passive delegation. Sub-scale: 35 sub-saturation MPOs holding 1.69B ADA whose entire fleet cannot fill one saturated pool — pledging is mechanically too small to matter. These are three different problems wearing the same label
Three distinct populations
The full picture
POL.O7.F3
No single parameter change addresses all three populations — each requires a different lever.Architectural responds to constitutional or contractual change (or to accepting that ~7.4B ADA is permanently outside the mechanism's scope). Strategic responds to altering the relative payoff of pledging vs delegating — i.e., reforming the pledge-yield curve so the bonus is no longer dominated. Sub-scale responds to a structural path (e.g., a shared-operations layer) for stake that cannot reach saturation alone. Raising a₀ — the "calibration" lever — addresses only the strategic group, and weakly
Reform constraint — three levers, not one
The full picture
OPE.O1.F1
The passive channel dominates the active one — the flat fee delivers 60% of operator revenue, the commission only 40%. Across the retail market, the fixed ₳/epoch flat fee accounts for 60% of operator revenue; the proportional commission accounts for the remaining 40%. The channel that dominates revenue is the one operators almost never touch.
Structural — the passive channel dominates the active one
Operator profitability versus delegator return
OPE.O1.F2
Governance halved the floor 178 epochs ago — 64% of pools have not moved. The minPoolCost floor was halved from 340 ₳ to 170 ₳ through a successful governance action. 178 epochs later (~1.5 years), 64% of pools still declare 340 ₳ — including most of the largest entities. The price most operators charge is not a pricing decision; it is a governance setting they never revised.
Governance inertia — driven by the largest entities
The flat fee (fixed cost)
OPE.O1.F3
The flat fee is a binary choice, not a pricing parameter.89.5% of pools declare one of two floor values (170 ₳ or 340 ₳). The "custom" values that exist are mostly near-floor inertia (Binance 345, Everstake 400) or commission-mode extraction. Operators are not pricing — they are picking a floor.
The flat fee is a binary choice, not a pricing parameter
The flat fee (fixed cost)
OPE.O1.F4
The flat fee is regressive by design — a fixed ₳ levy on a size-proportional reward. Because the pool reward grows roughly linearly with stake σ but the flat fee is fixed in ₳, the fee's share of pool reward follows a 1/σ hyperbola — 47.5% of pool reward at the sub-reliable tier, 1.5% at near-saturation. The same 170 ₳ that disappears in a saturated pool's accounts is a third of all rewards in a sub-reliable pool's accounts
Regressive by design — a fixed-in-₳ levy on a size-proportional reward
The flat fee (fixed cost)
OPE.O1.F5
No other major PoS protocol uses a flat fee — the fixed-cost model is unique to Cardano. Ethereum (validator-flat reward via the protocol), Solana (commission), Cosmos (commission), and Polkadot (commission) all price validators on proportional rules that scale with stake. The Cardano flat fee has no cross-chain precedent or comparator — meaning the regressive dynamics in F4 are unique to this network
Unique to Cardano — no cross-chain precedent
The flat fee (fixed cost)
OPE.O2.F1
The commission distribution is bimodal with an 89pp empty middle.87% of pools set a commission at or below 10%; 12% set ≥ 99% (privatisation). The 89-percentage-point range between 10% and 99% contains only 12 pools. No economic attractor exists between competitive pricing and total extraction — operators either compete or fully privatise their pool, and almost no one in between
No man's land — no attractor between pricing and extraction
The commission (margin)
OPE.O2.F2
The market self-organises into four discrete tiers, not a continuous price distribution. No-commission (170 pools, 17.9% — almost certainly self-pledged), competitive (658 pools, 69.1% — at or below 10%), no man's land (12 pools, 1.3% — between 10% and 99%), privatisation (112 pools, 11.8% — at or above 99%). The four bands are an emergent equilibrium, not a design choice — the formula offers a continuous parameter and operators reduce it to four economic stances.
The market self-organises into discrete tiers
The commission (margin)
OPE.O3.F1
A fifth of productive stake is custodial — and it splits into three distinct mechanisms, not one.79 entities operating 143 pools hold 4.55B ADA — 21.1% of productive stake in custodial pools. The split: (i) by pledge (10 entities, 36 pools, 1.59B — operator self-funds the pool); (ii) by extraction (57 entities, 79 pools, 2.04B — high commission on inert delegators); (iii) by delegation (15 entities, 28 pools, 0.92B — typical delegation ≥100K ₳). Each mechanism is detectable from on-chain observables and produces a different operator economics
Three distinct mechanisms
Custodial versus retail
OPE.O3.F2
The median delegation is what separates retail from custodial — not the mean. Custodial-by-delegation flags pools where the per-pool median delegation (db-sync epoch_stake) is ≥ 100K ₳ — i.e., where the typical delegator is a whale, not the average dragged up by one whale. For comparison, a delegation of 50K ₳ is already in the top 1.5% of all delegations on the network. The median measures the delegator's experience; the mean measures capital concentration. They are not the same signal.
The median measures delegator experience
Custodial by delegation — the median delegation signal
OPE.O3.F3
Each custodial mechanism produces a different economic outcome — by an order of magnitude. Median operator revenue per entity: custodial-by-pledge: 1,759,252 ₳/yr (operator captures 100% of rewards on self-funded pools); custodial-by-extraction: 281,831 ₳/yr (privatisation commission on inert-delegator pools); custodial-by-delegation: 29,329 ₳/yr (small whale pools, not revenue machines). Treating "custodial" as one population obscures a 60× revenue spread
Each custodial mechanism is its own economy
Summary
OPE.O4.F1
Once custodial pools are filtered out, the retail market is bigger than mean-based estimates suggested — and it includes institutions.809 retail pools, 516 entities, 17.02B ADA, 1,272,836 delegators. The retail-by-median-delegation classification keeps Coinbase, Binance, Kiln and other institutional operators inside the retail market — because their typical delegator is a small holder, even if the institutional brand is large. The retail market is the population the mechanism was designed for; it is the population every reform has to address
The retail market is larger than mean-based estimates
Summary
OPE.O4.F2
The typical retail delegator holds 87 ₳ — and the median is remarkably uniform across operator types. The median retail delegation across the entire 1.27M-delegator population is 87 ₳. Per-operator-type medians range from 45 to 962 ₳ — a tight 20× span across pool types from independent single-pool to Coinbase. Retail delegators are small, homogeneous, and yield-insensitive at this scale — any reform that prices below 87 ₳/year of incremental yield will not change their behaviour
Retail delegators are small and homogeneous
Operator profitability versus delegator return
OPE.O5.F1
A delegator pays 18× more for 0.30 percentage points of extra yield. A delegator in a sub-reliable pool pays a 48.3% effective price (flat fee + commission as % of pool reward) for a 2.04% net return. A delegator in a near-saturation pool pays 2.7% for 2.34% — 18× lower price for 0.30pp more return. The effective price is a mechanical artefact of pool size (the flat fee's 1/σ regression), not a market signal — operators are not pricing competitively, the formula is pricing them
Effective price is a 1/σ artefact, not a signal
Operator profitability versus delegator return
OPE.O5.F2
Net return converges to a narrow 1.95–2.34% band across the entire retail market — the signal is too weak to drive delegation. Regardless of pool size, operator type, or pricing plan, a retail delegator's net yield ends up between 1.95% and 2.34% — a 0.39 percentage point spread across the whole market. At this resolution, the yield signal cannot discipline operator pricing — delegators are not chasing 0.4pp of return; they are picking on visibility, brand, or convenience
Return signal too narrow to discipline pricing
Operator profitability versus delegator return
OPE.O6.F1
The operators who charge the most earn the least — and vice versa. A sub-reliable single-pool operator absorbs 48.3% of pool rewards but earns only 24,820 ₳/yr. An 11+ pool MPO absorbs only 7.7% of pool rewards but earns 1,035,496 ₳/yr — 42× more revenue at 6× less effective price. The flat fee penalises small-pool delegators without compensating the operators who run those pools — both sides of the small-pool transaction lose
Small pools penalise both sides
Operator profitability versus delegator return
OPE.O6.F2
MPO revenue scales horizontally (more pools), not vertically (higher price). The 11+ pool bracket captures 26.5% of retail rewards through 7 entities. Their per-pool fee is the same 170/340 ₳ floor everyone else uses — they win by running more pools, not by pricing differently. Fleet size, not pricing, drives MPO operator economics — meaning a reform that targets pricing leaves fleet revenue untouched
Fleet size, not pricing, drives operator economics
Operator profitability versus delegator return
OPE.O6.F3
The retail market is dominated by hollow operators — 95% of revenue, 0% pledge.57 hollow MPOs capture 64.4% of retail rewards; 414 hollow single-pool operators share 31.1%. Together hollow operators absorb 95.5% of retail reward flow through pools that pledge near-zero. The 41 balanced operators (those with meaningful pledge) share only 1.2%. Pledge is not the dominant revenue strategy — neither for fleets nor for single-pool operators
Structural concentration on hollow operators
Operator profitability versus delegator return
OPE.O6.F4
No single-pool operator in the retail market earns a competitive wage for their labour. Median single-pool revenue is ~25,000 ₳/yr (~6,250 at0.25/ADA) — covers infrastructure (~\$1,300–3,200/yr) but not the 5–15 hours/month of skilled DevOps at any reasonable hourly rate. Competitive compensation begins only at the 2-pool MPO tier (~68,700 ₳/yr). The single-pool operator is economically subsidising the network — sustained by non-economic motivation, not by the reward mechanism
Single-pool operators subsidise the network
Is operator revenue competitive? — a market benchmark
OPE.O7.F1
Two thirds of retail delegators sit in pools that pay less than the alternative — yield is not what they are choosing on.65.9% of retail delegators sit in hollow MPO pools at 2.18% net return; hollow single-pool near-saturation pools offer 2.34% — 0.16pp more — and yet hold only 2.7% of delegators. Delegators are not chasing yield — they are picking on visibility, brand, exchange convenience, or default selection. The return signal does not drive delegation
Delegation follows visibility, not return
Operator profitability versus delegator return
OPE.O7.F2
The pledge premium is negative in the retail data — balanced operators deliver less net return than hollow ones. Balanced (genuine pledge commitment) operators deliver a median net return of 1.98%; hollow operators deliver 2.08%. The reason is mechanical: balanced single-pool operators incur a 1.06pp flat-fee drag vs 0.47pp for hollow ones, and that drag overwhelms whatever pledge premium the reward curve is supposed to add. The incentive mechanism's core assumption — that pledge commitment translates to better delegator outcomes — does not hold in the data
The mechanism's core assumption fails
Operator profitability versus delegator return
OPE.O8.F1
The delegator yield has fallen from 5.3% to 2.0% in 5.5 years and the decline is built into the formula. Yield has tracked reserve depletion with R² = 0.99 across 413 epochs. Projection from epoch 623 (~April 2026): ~1.7% within ~12 months, sub-1.5% within ~20 months (~Q4 2027), sub-1.0% within ~42 months (~Q3 2029). The decline is irreversible without protocol-level intervention — it is built into the monetary expansion formula. The entire yield surface descends as a unit; no pool-level strategy can offset the macro trajectory
Yield decline is structural, not pool-level
The yield trajectory — level and decline
OPE.O8.F2
The confiscatory zone expands upward every epoch — the failures in §4 are not static, they get worse mechanically. As the epoch pot shrinks, the flat fee (fixed at 170/340 ₳) consumes a growing share of pool rewards — the confiscatory zone from §4.1 — The flat fee (fixed cost) expands upward. The 0.39pp retail yield spread compresses proportionally: at 1.0% base yield (~Q3 2029), the same relative dispersion produces ~0.20pp — indistinguishable from block-production noise. Pools productive today will cross the sub-reliable threshold purely from macro depletion. The failures documented in §4 are not static — they degrade every epoch
Failures degrade every epoch
The yield spread — structural compression
OPE.O8.F3
The declining yield is a selection ratchet against small single-pool operators. The flat fee is fixed in absolute terms while the epoch pot shrinks — the confiscatory zone expands upward every epoch. Single-pool operators bear the full drag with no fleet to amortise it; multi-pool operators are insulated by horizontal scaling. The structural feedback loop (yield compression → confiscatory expansion → single-pool attrition → delegation migration → fleet concentration) drives the centralisation the mechanism was designed to prevent
The mechanism selects against its smallest operators and reinforces its largest
The yield spread — structural compression
OPE.O9.F1
At 2.0%, Cardano sits below the USD risk-free rate and at the bottom of the PoS landscape. Cardano's current 2.0% delegation yield is below the USD risk-free rate of 4.3% and at the bottom of the PoS chains' yield ladder. No other major chain combines this low a yield with liquid, non-custodial, slashing-free design. The low return is the cost of that design — but the design now asks delegators to accept a yield below the risk-free rate, which only conviction-driven holders will do
Yield is uncompetitive vs alternatives
The yield in context — cross-chain and cross-asset comparison
OPE.O9.F2
The mechanism's premise depends on ADA appreciation that hasn't materialised — and if it doesn't, only conviction-driven holders remain. The reward formula was designed around a monetary regime where ADA itself appreciates (the reserve-depletion design implies deflationary-like behaviour as the supply approaches its cap). In practice, ADA price has not delivered that appreciation, leaving delegators with low yield + uncertain price. The mechanism's assumption — that yield-sensitive delegators allocate based on competitive returns — collapses to a self-selected pool of long-conviction holders, who do not respond to the formula's pricing levers. If the deflation premise fails, the psychological pressure compounds: there is no yield case AND no appreciation case, only a conviction case — which the formula cannot manufacture
Yield + price = double-sided pressure on the conviction case
The yield in context — cross-chain and cross-asset comparison
Reader Feedback
Comments and reactions are anchored to this page. Sign in with GitHub to post — threads live in the project Discussions.